0041
Regional and Lateralized Cortical Thickness Measurement in Children and Adolescents with Complex Congenital Heart Disease: Effects of Age, Gender, and Ciliary Dysfunction1Department of Pediatric Radiology, UPMC Children's Hospital of Pittsburgh, Pittsburgh, PA, United States, 2Developmental Biology, University of Pittsburgh, Pittsburgh, PA, United States, 3Department of Biomedical Informatics, University of Pittsburgh, Pittsburgh, PA, United States
Synopsis
Both regional and lateralized differences in cerebral cortical thickness were noted in CHD patients compared to controls during a protracted period of critical brain development during childhood and adolescent period. The regional vulnerability was localized to important known cognitive control network including the prefrontal region, salience network and the default mode network . Importantly, ciliary motion abnormalities accounted for most of these regional and lateralized differences in cortical thickness between CHD and controls, underscoring the importance of ciliary mutations/genetic abnormalities underlying cortical dysmaturation in CHD patients.
Introduction
Congenital heart disease (CHD) affects 0.8% of live births and has been identified as the most frequent birth defect1. Children born with CHD have a higher risk of neurodevelopmental defects, likely related to early brain dysmaturation2. Ciliary dysfunction and ciliary genetic alterations are also thought to play a role in the pathogenesis of heart and brain abnormalities in CHD. Ciliary genetic mechanisms are also likely involved in brain lateralization. In this study, we measured regional and lateralized cerebral cortical thickness between CHD patients and healthy controls during the critical period of childhood and adolescent brain development. We also examine the relationship between age, gender and ciliary dysfunction (as measured by nasal scrape).Methods
Demographics: 136 subjects were recruited to undergo a series of magnetic resonance scans, with 7 subjects receiving follow-up imaging at a later time point. 21 subjects experienced significant movement during their scans, and the resulting images contained motion artifacts that prevented their inclusion in our analysis. Our final analyzable study cohort contained 55 CHD patients and 60 healthy controls for a total of 115 subjects (49 female, 66 male), ages 6-57. T1-weighted images were processed using Freesurfer to parcellate cerebral cortical structures. A manual quality check was performed on each subject to ensure accuracy of the cortical segmentation3,4. Data were concatenated into a single image using the Freesurfer average template and compared for differences in cortical thickness with respect to subject age and gender. A sub-analysis was also performed among 34 subjects who consented to receive nasal epithelial ciliary motion videomicroscopy and ciliary motion scoring5. Our primary outcome was regional and lateralized (comparing right and left hemispheres) cortical thickness measurements between CHD patients and healthy controls, controlling for age. Our secondary analysis focused on delineation of the relationship of age, gender and nasal ciliary dysfunction on regional and lateralized cerebral cortical thickness in the entire sample.Results
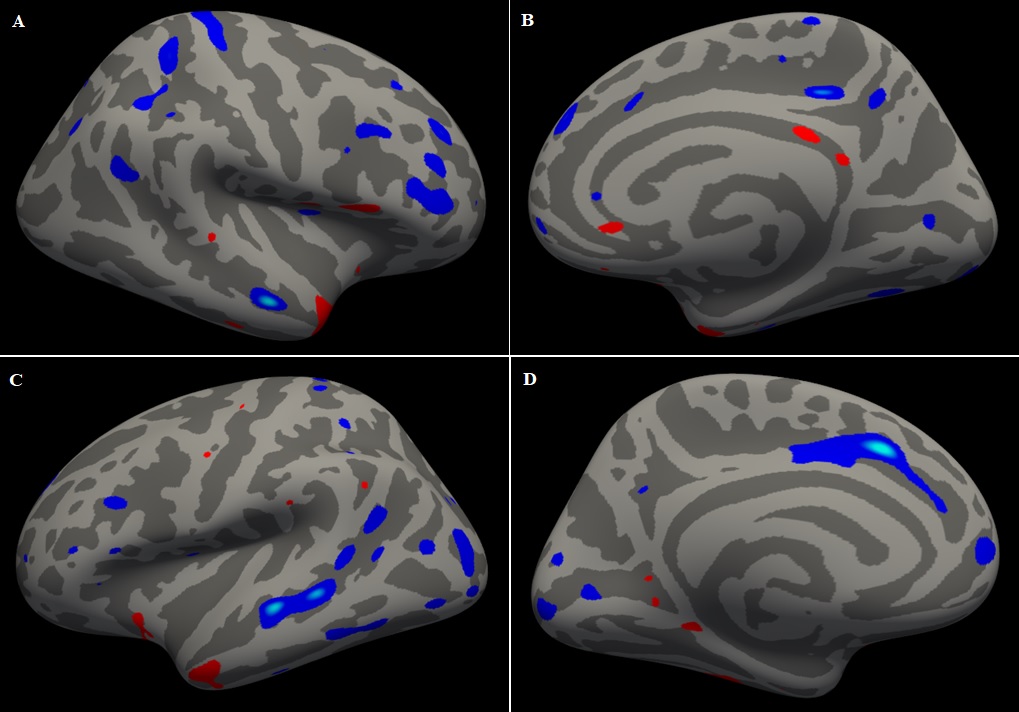
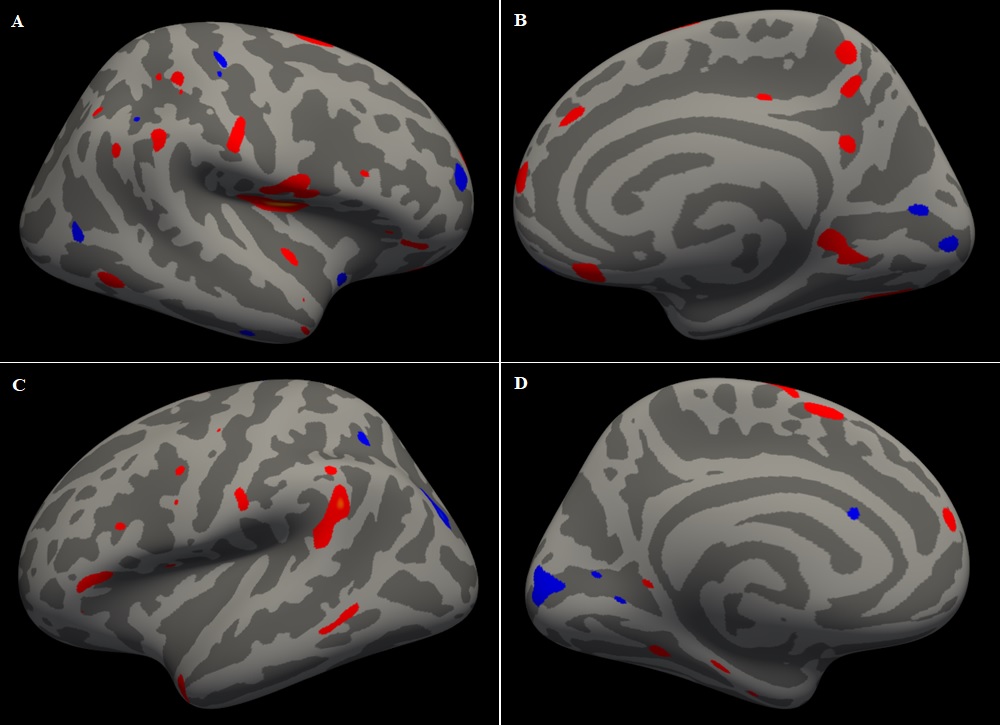
Reduced cortical thickness right hemisphere of CHD subjects relative to controls was observed in large regions of the prefrontal cortex, with more localized reductions in the precuneus (medial parietal) and the lateral parietal cortices (Figure 1AB). In contrast, smaller more localized regions of increased cortical thickness in the CHD subject’s vs control in the posterior cingulate (posterior default mode) and anterior temporal pole. Small regions of increased thickness compared to controls were seen in the operculum, cingulate, and bilaterally in the temporal poles. Lateralization analysis of the left hemisphere revealed marked differences compared to the right. hemisphere, with smaller localized regions of reduced cortical thickness in the anterior circulate (anterior default mode ) and the peri-opercular cortex (salience network) with no significant regions of increased cortical thickness between CHD and controls (Figure 1CD). There was overlap in the regional and lateraled relationships of age to cortical thickness measurements between CHD and controls, at a smaller magnitude (Figure 2), suggesting that childhood and adolescent is a protracted period of critical cortical maturation during this time. In contrast, regional gender differences in cortical thickness did not overlap and were non-lateralized , with increases in cortical thickness in females compared to males in the posterior portion of the brain (sensory-motor, peri-opercular, parietal, occipital, temporal) and decreased in cortical thickness in females compared to males in the prefrontal regions (Figure 3). Controlling for ciliary motion dysfunction accounted for both the reduced cortical thickness regional vulnerability in the prefrontal and parietal regions and also for the increased cortical thickness in the posterior cingulate region between CHD and controls , as well as lateralized cortical differences (Figure 4). Concordant with this, increased ciliary motion predicted focal areas of reduced cortical thickness in the prefrontal and parietal regions in contrast to increased ciliary motion abnormality predicting increased cortical thickness in the peri-opercular/peri-sylvian fissure regions with lateralized difference noted (Figure 5).Conclusion
Both regional and lateralized differences in cerebral cortical thickness were noted in CHD patients compared to controls during a protracted period of critical brain development during childhood and adolescent period. The regional vulnerability was localized to important known cognitive control network including the prefrontal region, salience network and the default mode network. Importantly, ciliary motion abnormalities accounted for most of these regional and lateralized differences in cortical thickness between CHD and controls, underscoring the importance of ciliary mutations/genetic abnormalities underlying cortical dysmaturation in CHD patients.Acknowledgements
No acknowledgement found.References
References
1. Reller, M. D., Strickland, M. J., Riehle-Colarusso, T., Mahle, W. T. & Correa, A. Prevalence of congenital heart defects in metropolitan Atlanta, 1998–2005. J. Pediatr. 153, 807–813 (2008)
2. Homsy, J., Zaidi, S., Shen, Y., Ware, J. S., Samocha, K. E., Karczewski, K. J., DePalma, S. R., McKean, D., Wakimoto, H.,Gorham, J. et al. De novo mutations in congenital heart disease with neurodevelopmental and other congenital anomalies. Science 350, 1262-1266. doi:10.1126/science.aac939 (2015)
3. Fischl, B., Dale, A.M. Measuring the thickness of the human cerebral cortex from magnetic resonance images. Proc Natl Acad Sci U S A 97, 11050-11055 (2000)
4. Rosas, H.D., Liu, A.K., Hersch, S., Glessner, M., Ferrante, R.J., Salat, D.H., van der Kouwe, A., Jenkins, B.G., Dale, A.M., Fischl, B. Regional and progressive thinning of the cortical ribbon in Huntington's disease. Neurology 58, 695-701 (2002)
5. Panigrahy, V. Lee, R. Ceschin, et al. Brain dysplasia associated with ciliary dysfunction in infants with congenital heart disease. J. Pediatr., 178, 10.1016/j.jpeds.2016.07.04. 141–148.e1(2016)
Figures