0040
Multimodal Stratification Biomarkers: Unravelling Electrophysiological Latency Differences in Autism Spectrum Disorder with the help of DTI and MEGAPRESS1Radiology, Children's Hospital of Philadelphia, Philadelphia, PA, United States
Synopsis
Electrophysiological delays in sensory (e.g. auditory) evoked responses are hallmarks of ASD. However, their magnitude is heterogeneous across the autism spectrum. This study approaches latency delay from a biophysical standpoint, focusing on axonal conduction velocity and synaptic transmission speed as potential mediators of ultimate latency. Combining MEG measures of cortical response latency with MR surrogates of conduction velocity (thalamocortical white matter diffusion fractional anisotropy) and synaptic transmission (MRS estimates of the neurotransmitter GABA) allows the stratification of children with ASD into subgroups dominantly dependent on conduction velocity vs synaptic transmission respectively. Such biological stratification may offer promise for targeted intervention.
Introduction
Both high white matter pathway conduction velocity and high synaptic transmission speed are necessary for efficient encoding of auditory sensory information. The M50 (~50ms) auditory evoked response in superior temporal gyrus (STG) is an integrative measure of auditory pathway latency, measurable by magnetoencephalography (MEG). In autism spectrum disorder (ASD), delayed M50 latency may contribute to abnormal auditory processing and language impairment [1]. Previous studies have shown correlation between M50 latency and diffusion MR indices of white matter maturation in typically developing (TD) controls through childhood and adolescence [2-4]. However, M50 latencies in ASD are heterogeneous; variance is not explained by white matter microstructure alone. We propose that M50 latency is dominantly modulated by white matter microstructure in one subgroup of ASD but is modulated by synaptic transmission in a separate subgroup. GABA is an inhibitory neurotransmitter and prior MRS studies have shown low GABA concentrations in ASD [5]. We combine diffusion MR, GABA MRS and MEG measures of M50 latency to identify multiple physiological mechanisms underlying auditory processing efficiency in ASD and to stratify children on the autism spectrum according to differing biological etiologies.
Methods
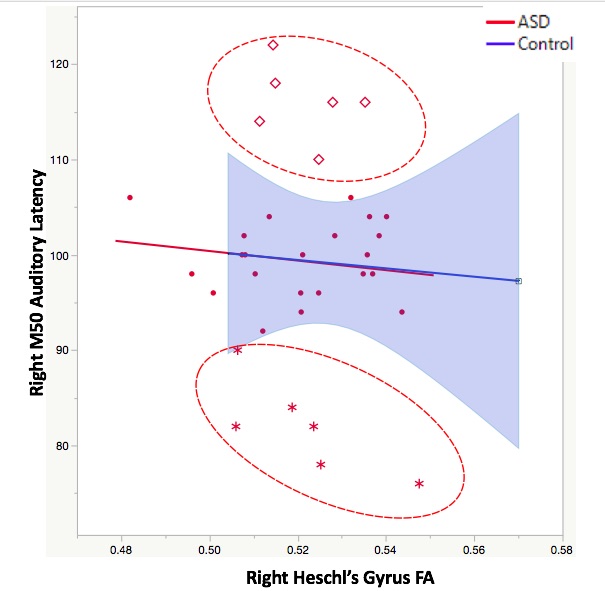
This study included 34 children with ASD (10.6±1.3years) and 17 typically developing (TD) children (10.0±1.3years) with evaluable DTI, MRS and MEG data. MRI was acquired on a 3T Verio (32 channel head coil). DTI parameters (Siemens WIP511E) were 30 diffusion gradient directions at b=1000s/mm2, TR/TE= 11s/76ms, voxel size 2x2x2mm, and 128x128 matrix. Eddy_cuda 5.0.11 was run on a GPU cluster to correct diffusion MR for eddy currents/movement [6]. Registration of each subject to the MNI template was performed to extract DTI parameters from a Heschl’s gyrus ROI. MRS used a single voxel edited MEGAPRESS sequence (TR/TE=1500ms/80ms, 128 transient pairs) with suppression of co-edited macromolecules via editing pulses placed at 1.9 and 1.5ppm respectively (Siemens WIP529). Voxels (4x3x2cm) were placed in STG, with the long axis along the Sylvian fissure and the short axis abutting the lateral ventricle in the axial plane. MEG was performed with a 275-channel whole head system (CTF). Stimuli consisted of 500Hz tones presented binaurally at 45dBSL at pseudo-random inter-stimulus-intervals (600-2000ms). After rejection of cardiac, blink and other extraneous artifacts, evoked responses (1200Hz sample-rate) were averaged, filtered (1-40Hz) and source modeled bilaterally using BESA 6.1; the M50 response component was identified as the first peak in the interval 50-150ms (allowing for age- and ASD-related delays) with appropriate dipolar scalp magnetic field topography. A linear model between M50 and auditory FA in TD’s established the 99th percentile confidence interval of the typical structure-function relationship. ASD subjects were stratified into three groups based upon their position on the typically developing M50 vs FA curve: 1) within the 99th percentile, 2) long M50 latencies above the 99th percentile and 3) short M50 latencies below the 99th percentile. Since, white matter microstructure was not the dominant modulator of M50 in the outlier subgroups, GABA levels in STG were compared between these subgroups to determine if levels of the neurotransmitter accounted for observed M50 latencies.
Results
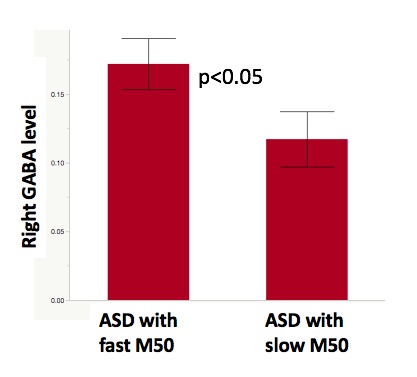
Figure 1 shows the 99th percentile confidence interval of M50 vs FA from the TD population and overlaid ASD data. 22 ASD subjects (~65%) were within the typical structure-function curve (red dots). 6 ASD subjects (diamonds) were above the 99th percentile confidence interval and exhibited longer M50 latencies than their white matter microstructure predicted. 6 ASD subjects (asterisks) were below the 99th percentile confidence interval and exhibited faster than expected M50 latencies. The two subgroups outside the typical structure-function curve were not distinguishable based on FA. Among the ASD subgroup within the typical M50 vs FA confidence interval, GABA levels were not predictive of M50 latency (p>.05). Similarly, the GABA level in TD was not predictive of M50 (p>.05). However, among the ASD subjects above or below the 99th percentile confidence limits, GABA was indeed predictive of M50 (p<0.05). Furthermore, within this “atypical” group, group comparison of the two clusters (faster/slower than predicted by their white matter) revealed higher GABA levels in the outlier subgroup with shorter M50 compared to the outlier subgroup with longer M50 (t-test, p<0.05, figure 2).Discussion/Conclusion
This suggests stratification of ASD subjects may be performed based on the physiological factor (white matter structure or GABA levels) which dominantly modulates the speed of sensory input. While white matter maturation predicts cortical response latency in typical development and in a sub-cohort of children with ASD, in other ASD sub-cohorts response latencies are not predictable by white matter measures alone. In these cases, a latency dependency on neurotransmitter GABA is noted (with higher GABA levels indicating faster response latencies). Stratification based on etiology can potentially pave the way for tailored/personalized therapy.
Acknowledgements
This work was supported in part by NIH R01-DC008871-10, NIH U54-HD086984. Dr Roberts thanks the Oberkircher family for the Oberkircher Family Chair in Pediatric Radiology at CHOP. The authors thanks Siemens Medical Solutions (Drs Heberlein and Feiweier) for WIPs 511E and 529.References
1) Roberts, T. P. L., et al. (2010). "MEG detection of delayed auditory evoked responses in autism spectrum disorders: towards an imaging biomarker for autism." Autism Research 3(1): 8-18.
2) Roberts, T. P. L., et al. (2009). "Developmental correlation of diffusion anisotropy with auditory-evoked response." Neuroreport 20(18): 1586-1591.
3) Roberts, T. P. L., et al. (2013). "Maturational differences in thalamocortical white matter microstructure and auditory evoked response latencies in autism spectrum disorders." Brain research 1537(0): 79-85.
4) Berman, J. I., et al. (2016). "Multimodal Diffusion-MRI and MEG Assessment of Auditory and Language System Development in Autism Spectrum Disorder." Frontiers in Neuroanatomy 10: 30.
5) Gaetz, W., et al. (2014). "GABA estimation in the brains of children on the autism spectrum: Measurement precision and regional cortical variation." NeuroImage 86: 1-9.
6) Jesper L. R. Andersson and Stamatios N. Sotiropoulos. An integrated approach to correction for off-resonance effects and subject movement in diffusion MR imaging. NeuroImage, 125:1063-1078, 2016.
Figures