0039
Cortical Thickness and White Matter Connectivity in preschool Children with Autism Spectrum Disorder1PLA General Hospital, Beijing, China, 2Tsinghua University, Beijing, China, 3Center for MRI Research, Academy for Advanced Interdisciplinary Studies, Peking University, Beijing, China, 4Beijing Jishuitan Hospital, Beijing, China
Synopsis
Structural magnetic resonance imaging (MRI) is suitable to describe brain anatomy, and altered cortical thickness and connectivity are the keys feature of autism spectrum disorder (ASD) pathophysiology. By processing T1-weighted imaging and diffusion-tensor imaging data from same subjects, cortical thickness and white matter connectivity were shown respectively, and some differences of brain areas were found between typically developing (TD) preschool children group and ASD, which might be related to the behaviors of ASD preschool children. Compared with TD, the thickness of right middle post cingulada gyrus and sulcus increased and its close white matter's fractional anisotropy (FA) of right superior frontal area decreased (P<0.01) in ASD group. These findings may be the morphological biomarkers, which will help guide the precise intervention or treatment in preschool children with ASD as some new neural circuits.
Abstract
Purpose: The present study aimed to expand current knowledge regarding the early diagnosis of autism spectrum disorder (ASD), and potentially discover the pathological mechanisms underlying psychiatric developmental disorders.
Methods: An institutional review board approved the present retrospective case-control study, and all participants and their guardians provided written consent. By using FreeSurfer (6.0.0;http://surfer.nmr. mgh.harvard.edu/) to process T1W data[1] and DSI Studio (7 2018 build; http://dsi-studio. labsolver.org/) to process DTI data [2]. To assess 21 ASD participants, 21 age-matched typically developing (TD) children with no previous history of neurological or psychiatric problems were recruited as controls. Diagnoses of ASD were based on Diagnostic and Statistical Manual of Mental Disorders, Fifth Edition (DSM-V) (Table 1). All participants had normal or corrected-to-normal vision, and no participants reported the use of psychotropic medications. The exclusion criteria were metal implants, psychiatric and neurological disorders, congenital structural brain abnormalities, and known genetic conditions. Structural magnetic resonance imaging (MRI) scans were read as normal by experienced neuroradiologists, and none of the children exhibited any signs of prematurity-associated brain lesions on MRI at a term-equivalent age, as assessed by case report forms. The study protocol was approved by the Medical Ethics Committee of the Chinese PLA General Hospital and was fully disclosed to all participants and their guardians. Three-dimensional fast spoiled gradient echo (3D-FSPGR) images were processed, and cortical thickness was measured as the distance of corresponding vertices between the gray-white and its boundary[3]. DTI images were obtained to statistically analyze the spatial distribution. Bundle segmentation was performed by an expert radiologist using manually placed inclusion and exclusion regions of interest (ROI). Fractional anisotropy (FA) measure has been shown to reflect components of fiber integrity[4]. High-resolution T1-weighted images (T1W) and DTI were available from all sites; they were collected on 3.0T MRI system (Discovery MR750 system) scanners. MR 750 using 3D-FSPGR for T1W (Thickness=1.0 mm; Slices=156; Time of Repetition,TR=Minimum; Time of Echo, TE=Minimum; Time of Inversion, TI=450 ms; Field Of View, Field of View, FOV=240mm×240mm; 1.0*1.0*1.0mm3 voxels; Acquisition Matrix=240×240; Number of Echoes)=1; Flip Angle=12 degree ) and DTI (TR=8000/minimum msec; Diffusion Directions=24; two excitations; b value=800 sec/mm2; two T2-weighted images; Acquisition Matrix=112×112; FOV=224×224 mm; Thickness=2.0 mm; Gap=0 mm; Slices =64). Levene test of variance equation with Statistical Product and Service Solutions (SPSS) was used for all parameters with P value of .01 or less considered indicating statistical significance in our results.
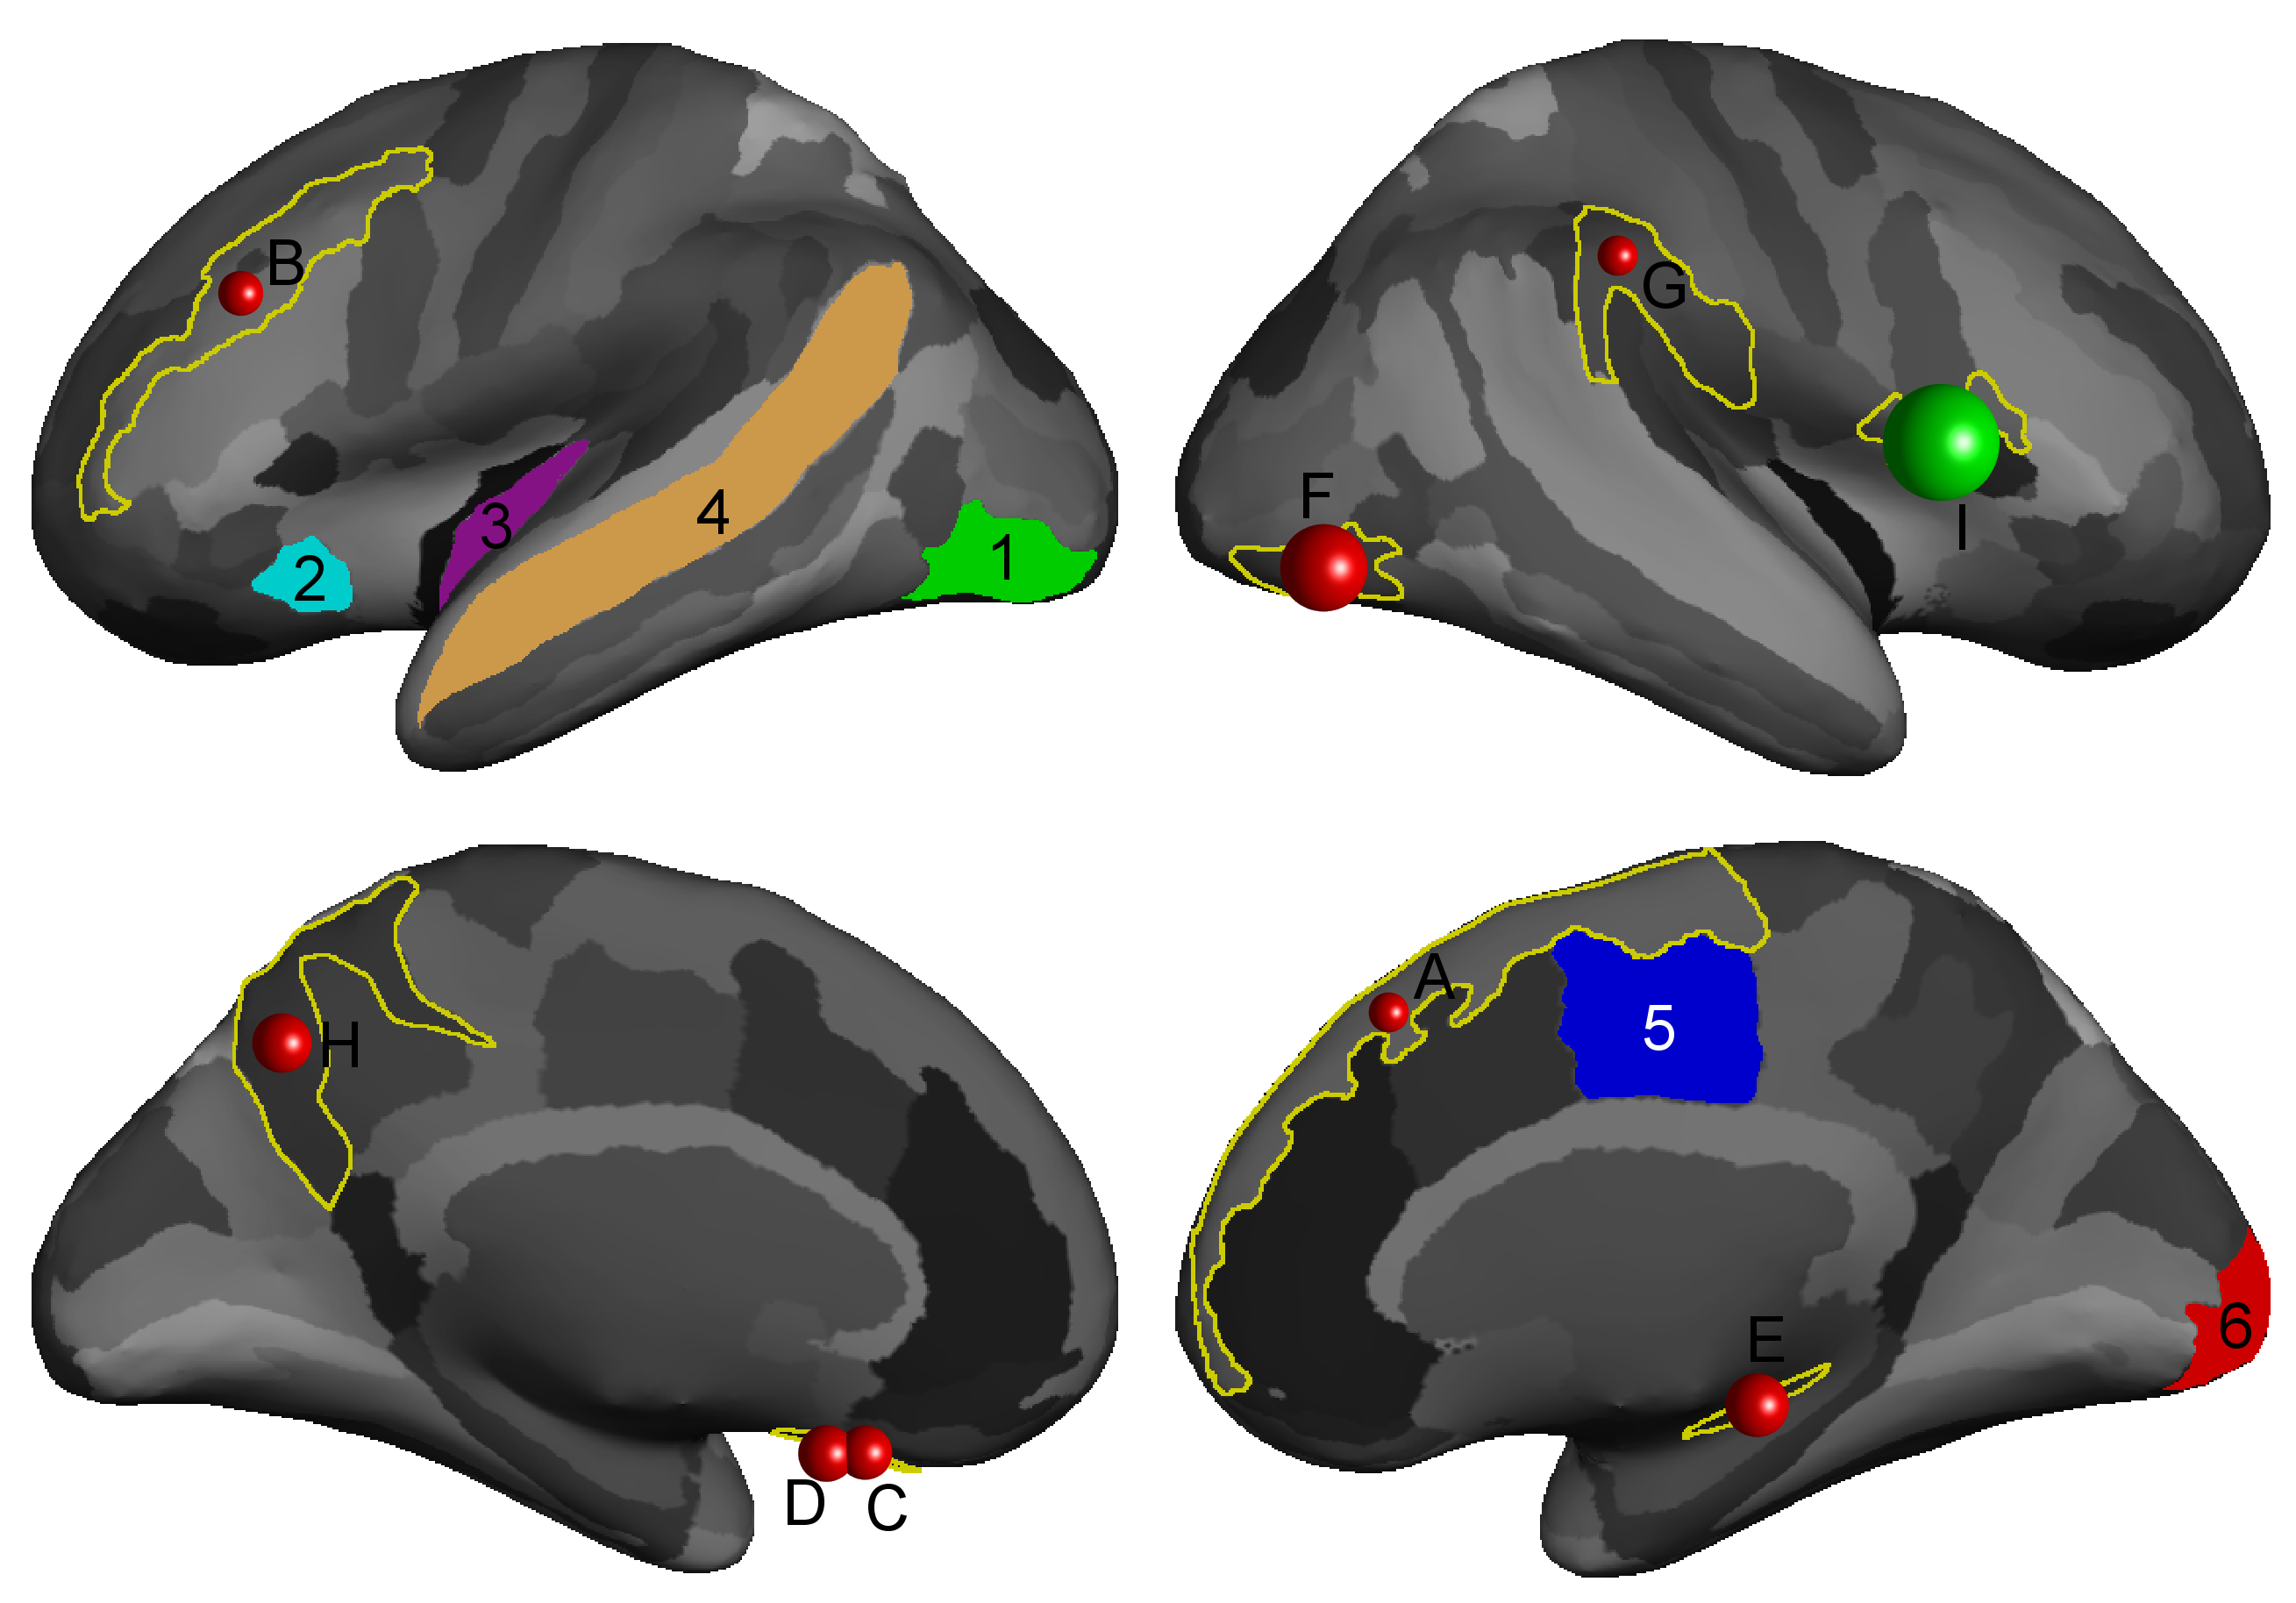
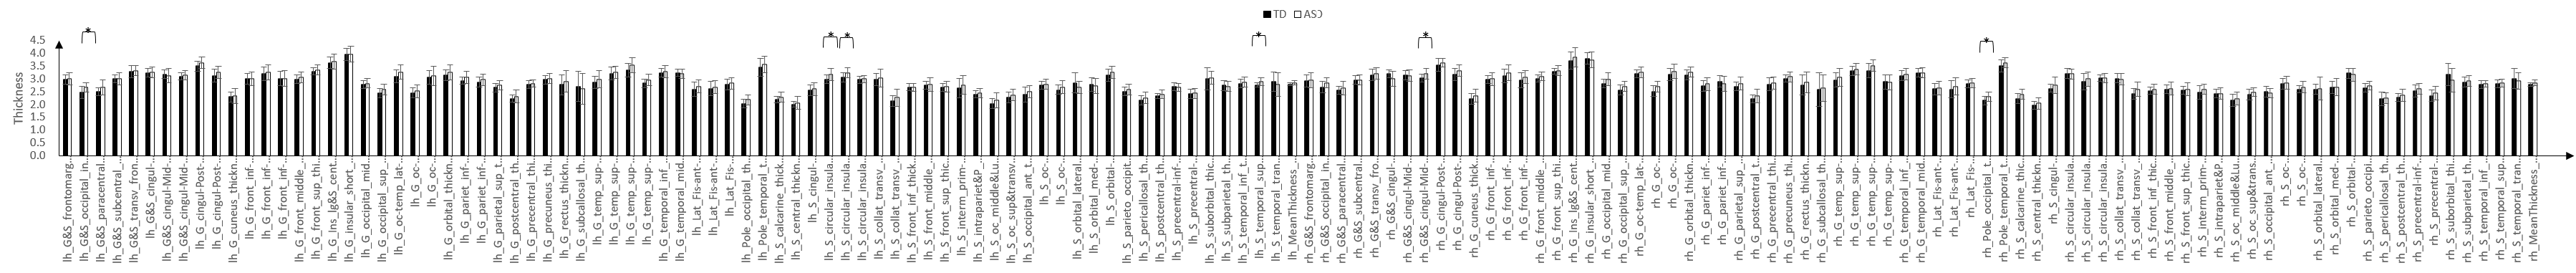
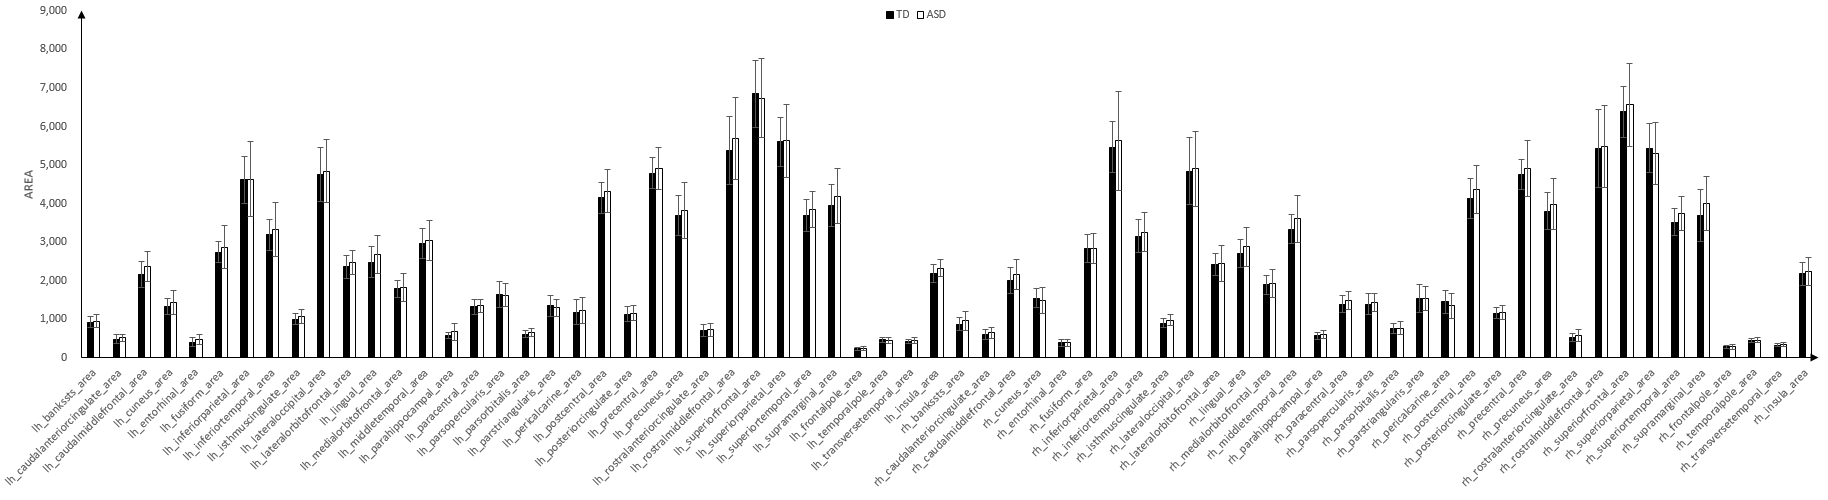
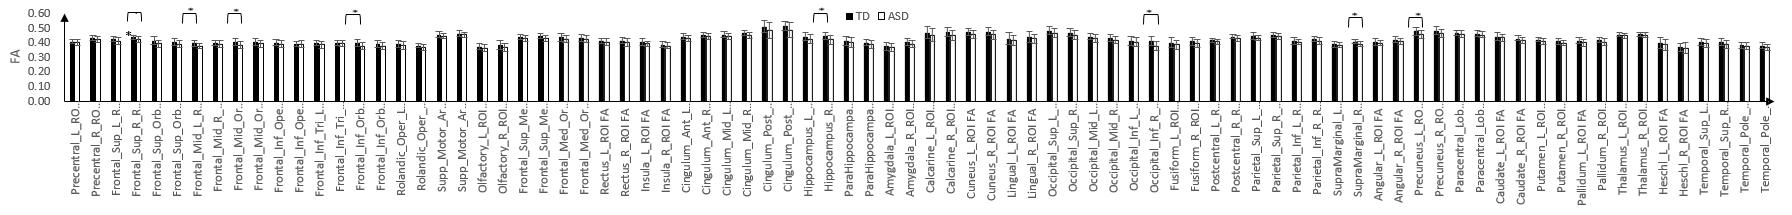
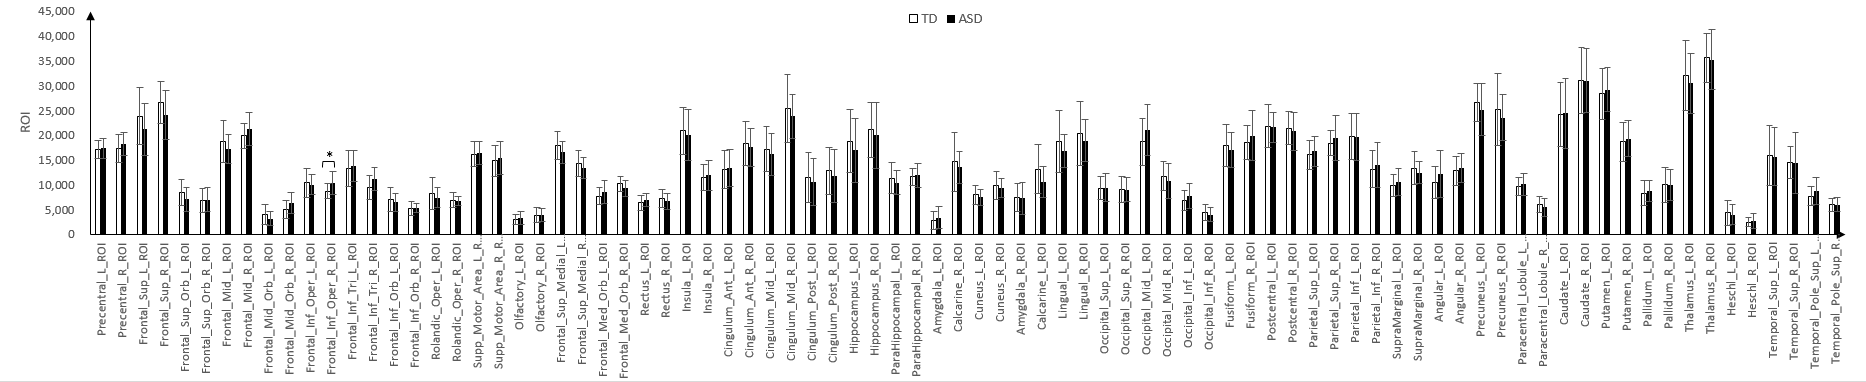
Results: Cortical thickness and surface area were calculated according to the matrix with 154 gyrus and sulcus per subject and 74 areas per subject. White matter fibers' numbers of ROI and its FA were analyzed with 84 regions and 1 million seeds per subject. Compared with the TD group, children with ASD demonstrated significant increases (P<0.01) in cortical thickness were mainly found in Ggyrus and Sulcus of Occipital_Inf_Left (TD: mean value, 2.463±0.243 [standard deviation] vs ASD: 2.663±0.178), Sulcus of Circular_Insula_Ant_Left (2.985±0.164 vs 3.161±0.227), Sulcus of Circular_Insula_Inf_Left (3.052±0.186 vs 3.225±0.196), Sulcus of Temporal_Sup_Left (2.760±0.090 vs 2.880±0.161), Ggyrus and Sulcus of Cingul-Mid-Post_Right (3.028±0.151 vs 3.197±0.216) and Pole_Occipital_Right (2.150±0.167 vs 2.309±0.184). Cortical surface area was measured as the area of triangles surrounding a vertex along the white matter interface. There is no significant various between the two groups different areas (P>0.01) (Figure 1-3). Compared with the TD group, children with ASD demonstrated significant decreases (P<0.01) of ROI FA were mainly found in Frontal_Sup_Right (0.436±0.015 vs 0.420±0.021), Frontal_Mid_Left (0.394±0.019 vs 0.377±0.020), Frontal_Mid_Orb_Left (0.403±0.025 vs 0.382±0.025), Frontal_Inf_Orb_Left (0.397±0.024 vs 0.375±0.022), Hippocampus_Right (0.445±0.023 vs 0.420±0.032), Occipital_Inf_Right (0.410±0.031 vs 0.377±0.029), SupraMarginal_Right (0.407±0.015 vs 0.391±0.017) and Precuneus_Left (0.478±0.027 vs 0.455±0.027). Significant increases (P<0.01) of ROI were found in Frontal_Inf_Oper_Right (8690.048±1525.368 vs 10342.429±2231.816) (Figure 1, Figure 4-5).
Conclusions: Cortical thickness increases were observed in ASD[1], which was also seen in 6 areas of this study. That would be related to neuronal or synaptic density, and affect children's neuron development. ASD toddlers displayed abnormal age-related changes with FA and had an overall slower than typical apparent rate of continued development across the span of years[5]. Then FA was lower in the 14.4±3.4 years old ASD[6], which was also seen in 8 brain areas of preschool ASD children in this study. The present study aimed to localize brain abnormalities in preschool-age children with ASD, uncover the molecular mechanisms underlying the stereotyped behaviors observed in ASD children, and illustrate the importance of structural MRI and DTI assessments in the treatment of ASD. Structural MRI and DTI have emerged as the methods to noninvasively measure white matter microstructure in a real time throughout children's life span. In future research, our group will improve the speed and method applied for ASD assessments in larger samples.
Acknowledgements
Financial support was received from Capital's Funds for Health Improvement and Research (CFH2018-2-5012), Translational Medicine Project of PLA General Hospital 2016 (2016TM-001), and Medical Big Data Research and Development Project of PLA General Hospital (2017MBD-003).References
[1] Hong SJ, Valk SL, Di Martino A, Milham MP, Bernhardt BC. 2018. Multidimensional neuroanatomical subtyping of autism spectrum disorder. Cerebral cortex (New York, NY : 1991). 28(10):3578-3588.
[2] Maier-Hein KH, Neher PF, Houde JC, Cote MA, Garyfallidis E, Zhong J, Chamberland M, Yeh FC, Lin YC, Ji Q et al. 2017. The challenge of mapping the human connectome based on diffusion tractography. Nature communications. 8(1):1349.
[3] la Fougere C, Grant S, Kostikov A, Schirrmacher R, Gravel P, Schipper HM, Reader A, Evans A, Thiel A. 2011. Where in-vivo imaging meets cytoarchitectonics: The relationship between cortical thickness and neuronal density measured with high-resolution [18f] flumazenil-pet. Neuroimage. 56(3):951-960.
[4] Yeh FC, Badre D, Verstynen T. 2016. Connectometry: A statistical approach harnessing the analytical potential of the local connectome. Neuroimage. 125:162-171.
[5] Solso S, Xu R, Proudfoot J, Hagler DJ, Jr., Campbell K, Venkatraman V, Carter Barnes C, Ahrens-Barbeau C, Pierce K, Dale A et al. 2016. Diffusion tensor imaging provides evidence of possible axonal overconnectivity in frontal lobes in autism spectrum disorder toddlers. Biological psychiatry. 79(8):676-684.
[6] Ameis SH, Lerch JP, Taylor MJ, Lee W, Viviano JD, Pipitone J, Nazeri A, Croarkin PE, Voineskos AN, Lai MC et al. 2016. A diffusion tensor imaging study in children with adhd, autism spectrum disorder, ocd, and matched controls: Distinct and non-distinct white matter disruption and dimensional brain-behavior relationships. The American journal of psychiatry. 173(12):1213-1222.
Figures
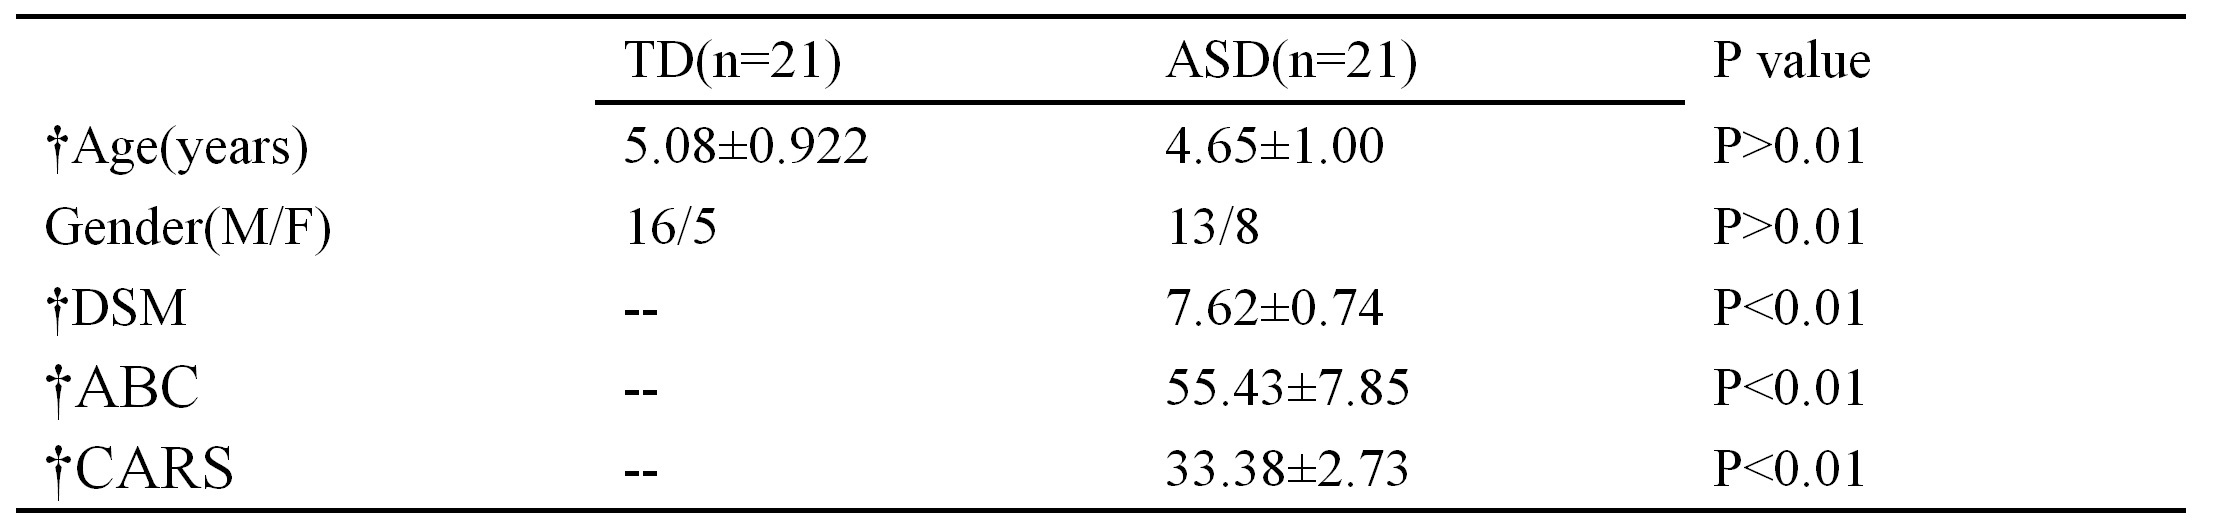
Table 1 Demographic and Neuropsychologic Characteristics of TD and ASD Groups
Note—ABC = Autism Behavior Checklist, ASD = autism spectrum disorder, CARS = Childhood Autism Rating Scale, DSM = Diagnostic and Statistical Manual of Mental Disorders Global Assessment of Functioning, TD = typical development * The P value for the intergroup age difference was obtained by t test. The P value for the intergroup sex distribution was obtained by using a x2 test. The P value for the Childhood Autism Rating Scale was obtained by using Wilcoxon test. † Data are mean 6 standard deviation.