0033
Early Language and Motor Functional Network Connectivity from Infancy to Early Childhood1Warren Alpert School of Medicine, Brown University, Providence, RI, United States, 2Women and Infants Hospital of Rhode Island, Providence, RI, United States, 3MNCHD & T, Bill & Melinda Gates Foundation, Seattle, WA, United States
Synopsis
While childhood is a period of rapid brain development defined by early motor and language milestones, very little is known about the development of functional networks with increasing milestone abilities. We investigated correlation patterns between resting state functional MRI network connectivity and standardized scores for motor and language milestone functions in a large cohort of typically developing children spanning from 3 months to 6 years of age. We demonstrate distinct functional network connectivity patterns for major motor and language milestone functions, which increase in number with task complexity.
Introduction
Childhood is a period of rapid brain development defined by early motor and language milestones. With age, these developmental skills become increasingly refined and occur in tandem with dynamic changes of brain growth and the emergence and optimisation of functional neural networks1. These milestones progressively occur with increasing complexity, starting with gross to fine motor skills and finally progressing to more complex abilities such as the development of language function. This early progression is vital in the system's preparation for more complex functions, and possibly functional connectivity networks2.
However, little is known about the development of these functional networks with increasing motor and language milestone abilities spanning all periods of milestone development from infancy to early childhood2. In order to address this lack in knowledge, we investigated correlation patterns between resting state functional MRI (rsfMRI) network connectivity and standardized clinical developmental scores for motor and language milestone abilities in a large cohort of typically developing children spanning from 3 months to 6 years of age.
Methods
Resting state functional data and structural scans were acquired for 196 children (24.4 months average age, 2.8-72.2 months age range, 87 females) on a 3T Siemens Trio scanner. To assess language and motor milestone development, we used the t values of the Mullen Scales for Early Learning3 for gross and fine motor, as well as receptive and expressive language. Resting state fMRI data were acquired during natural sleep with the following parameters: TE = 34ms, TR = 2.5s, voxel resolution: 3x3x6mm3, 32 slices. Functional MRI data were first preprocessed (realignment, centering, motion correction, scrubbing) with the CONN toolbox4 on MATLAB and registered to our child study template using FSL FLIRT5 and ANTS6. Group level ROI-to-ROI connectivity analysis was performed with CONN to determine differences in brain connectivity with the different Mullen t scores. Sex, gestational corrected age and maternal SES were defined as covariates in the analysis and significance was defined as p≤.05 FDR seed-level corrected for multiple comparisons. 164 ROIs corresponding to commonly reported networks were used in the analysis6.Results
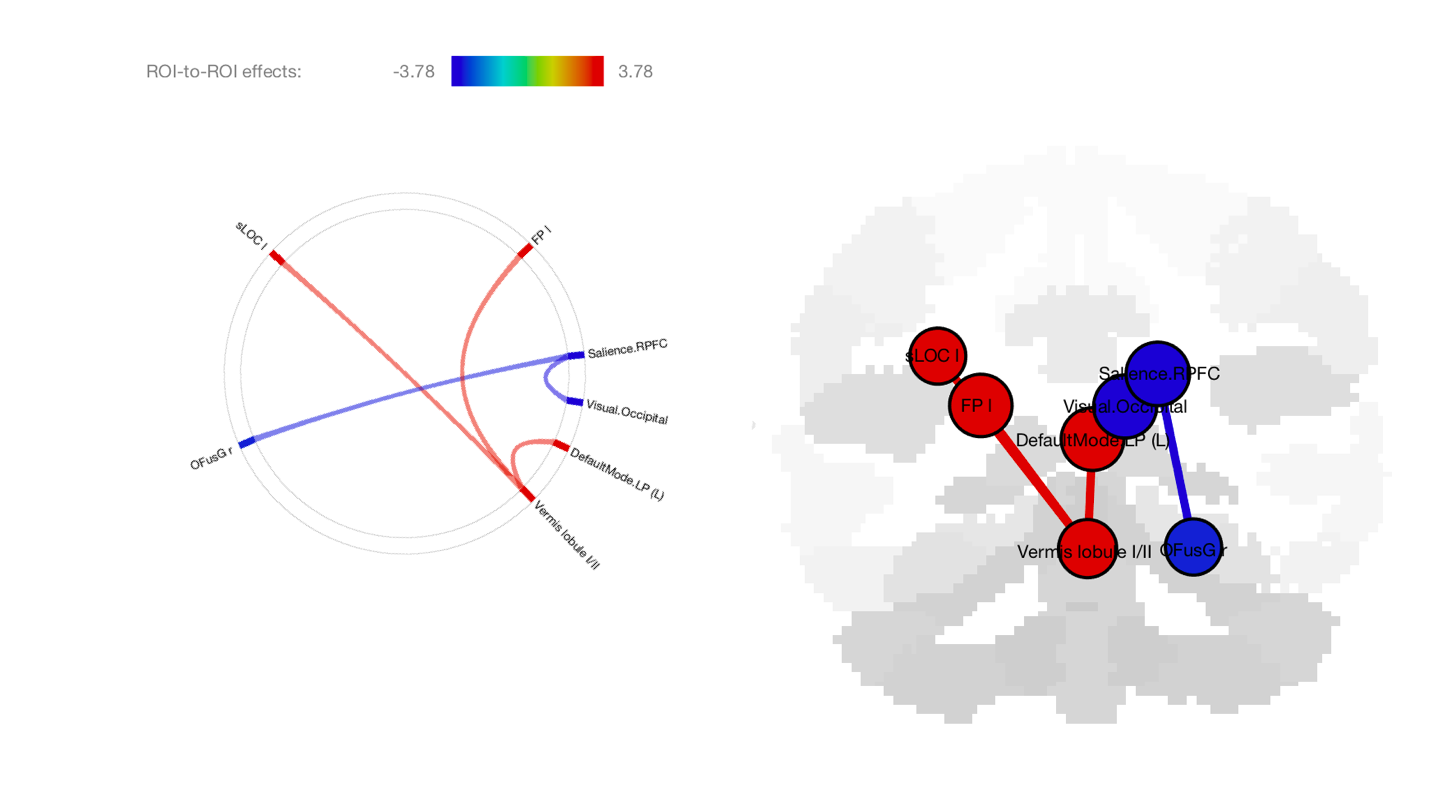
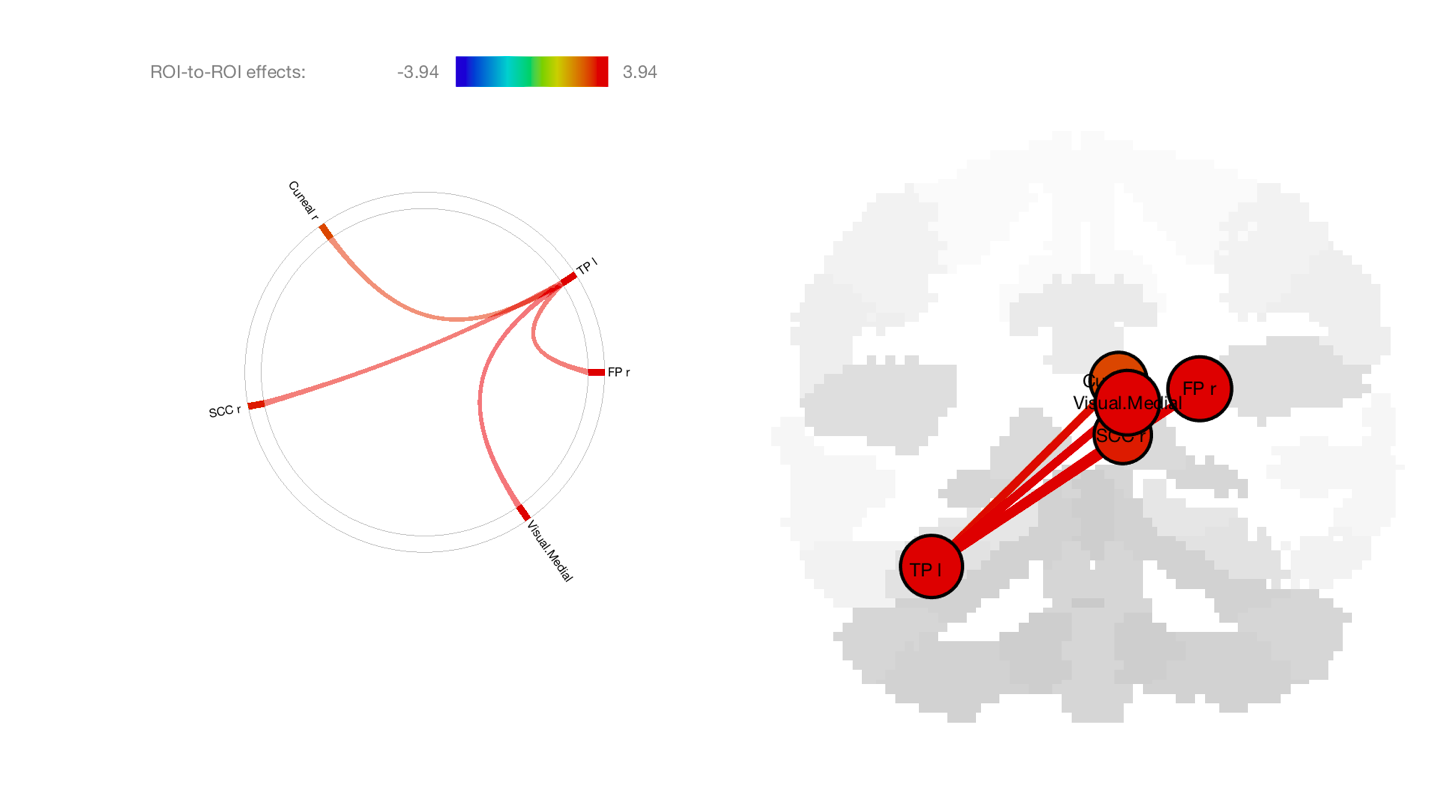
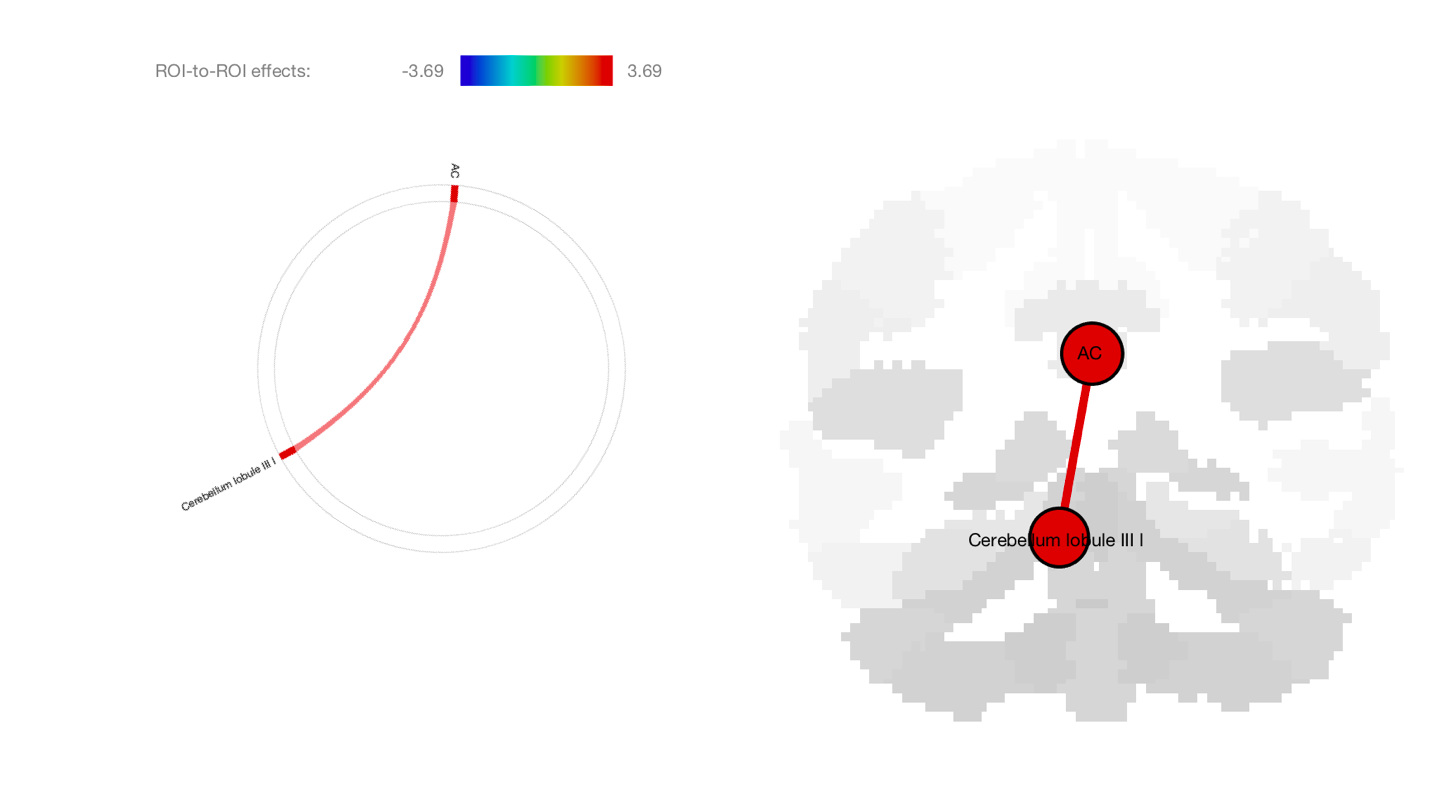
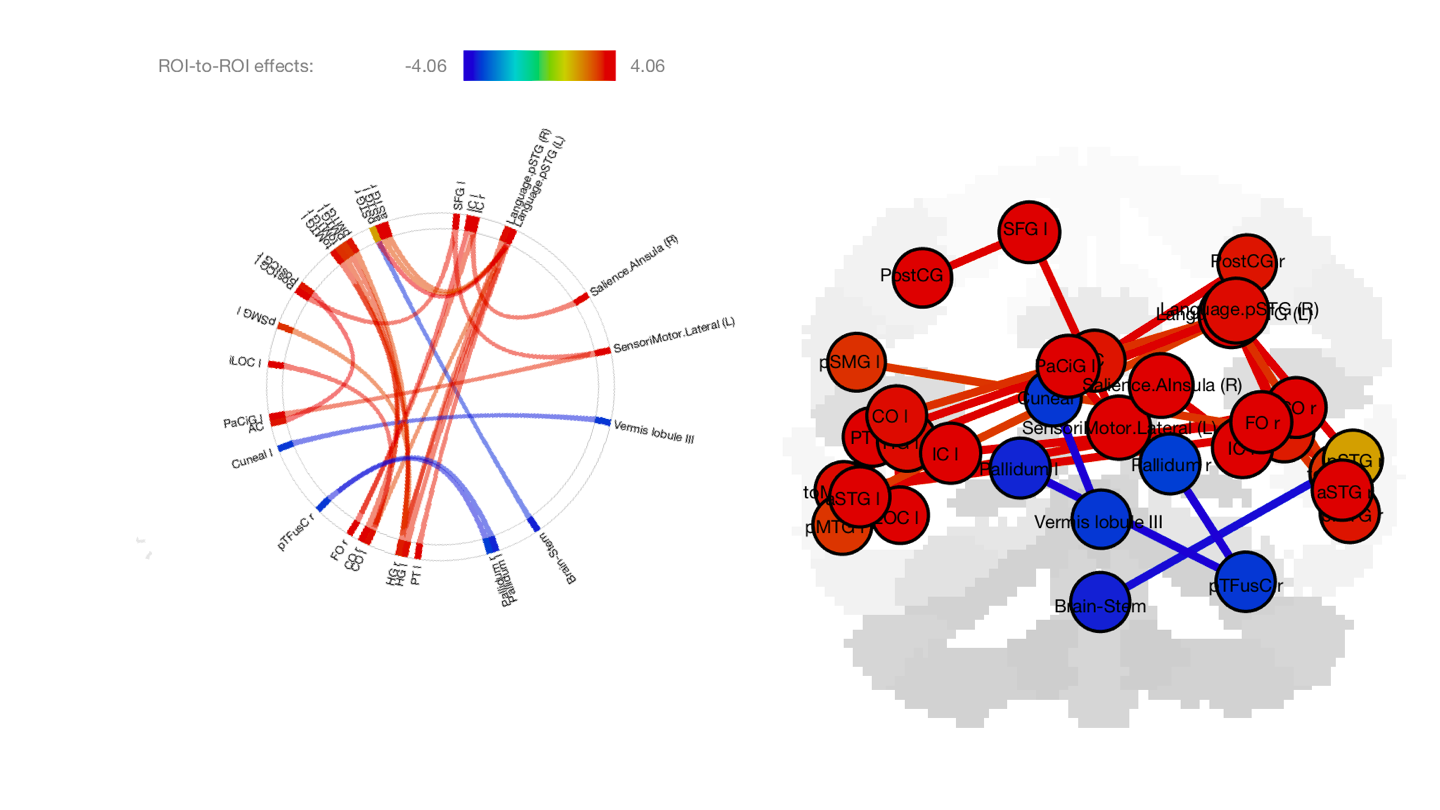
Increasing gross motor T scores were significantly associated with decreased functional connectivity in occipital regions, the cerebellum as well as frontal default mode networks (Figure 1). Fine motor T scores were associated with increasing connectivity in occipital, temporal, frontal and visual networks (Figure 2). Receptive language T scores were associated with increased connectivity in deeper regions of the brain; namely the cingulate cortex and the cerebellum lobule III (Figure 3). Expressive language T scores were associated with decreased connectivity in deeper brain regions and temporal regions, and additionally associated with increased connectivity of sensorimotor and temporal language networks as well as other frontal, temporal, limbic, parietal and occipital regions (Figure 4).Discussion
We demonstrate distinct functional network connectivity patterns for three major milestone functions in a large typically developing cohort spanning early infancy to young childhood. Interestingly, the more complex the milestone ability, the more functional connectivity networks were recruited (i.e. gross to fine motor and receptive to expressive language). This is in line with an early observation from an infant and toddler rsfMRI study suggesting that gross motor skill development is vital to adaptive function and predictive of cognitive outcomes2. Further paralleling their findings, our study also showed a correlation with motor and default mode networks. Fine motor functioning in return demands the recruitment of the visual cortex in addition to occipital and temporal networks, to enable sensorimotor-independent refinement and thus selectively and successfully develop hand and tool coordination7. Expressive language in comparison to receptive language and motor function increases in complexity when it comes to task demands. While receptive language only craves the passive ability to understand what has been said, expressive language demands an array of active functions from vocabulary usage in order to put words together to the ability to communicate and express oneself. This is both displayed in the variety and number of networks recruited as well as the network regions recruited. Receptive language was associated with increased rsfMRI connectivity in evolutionary older structures, whereas expressive language was negatively correlated with evolutionary older but positively correlated with evolutionary newer brain structures8,9.Conclusions
We demonstrate distinct functional network connectivity patterns for three major milestone functions in a large typically developing cohort spanning early infancy to young childhood. With milestone complexity, more functional connectivity networks spanning evolutionary newer brain regions were recruited, with an opposite trend for earlier developing and less complex milestone functions. This additional understanding of functional connectivity development with milestone achievement in typical childhood development lays the foundation for future studies exploring the divergence of these networks in disease and disability.Acknowledgements
No acknowledgement found.References
1. Silbereis, J.C., et al. (2016). The cellular and molecular landscapes of the developing human central nervous system. Neuron, 89(2), 248-268. 2. Marrus, N., et al. (2018). Walking, gross motor development, and brain functional connectivity in infants and toddlers. Cereb Cortex, 28(2), 750-763. 3. Mullen, 4. Whitfield-Gabrieli, S. & Nieto-Castanon, A. Conn: a functional connectivity toolbox for correlated and anticorrelated brain networks. Brain Connect. 2, 125–141 (2012). 5. Smith, S. M. et al. Advances in functional and structural MR image analysis and implementation as FSL. NeuroImage 23 Suppl 1, S208-219 (2004). 6. Avants, B. B. et al. The Insight ToolKit image registration framework. Front. Neuroinformatics 8, (2014). 7. Striem-Amit, E., et al. (2017). Sensorimotor-independent development of hands and tools selectively in the visual cortex. PNAS, 114(18), 4787-4792. 8. Kaas, J. H. (2013). The evolution of brains from early mammals to humans. Wiley Interdisc Rev Cogn Sci, 4(1), 33-45. 9. Barton, R. A., Harvey, P. H. (2000). Mosaic evolution of brain structure in mammals. Nature, 405, 1055-1058.Figures