0031
Increased brain perfusion in neonatal hypoxic ischemic injury with negative reading of DWI, T1/T2-weighted images: Implications of perfusion MRI for reperfusion response monitoring and prognostication1Children's Hospital of Philadelphia, Philadelphia, PA, United States, 2Yantai University, Yantai, China, 3University of Pennsylvania, Philadelphia, PA, United States
Synopsis
Brain perfusion plays an important role in the diagnosis and prognosis of neonatal hypoxic ischemic injury (HII). However, the studies on perfusion changes in HII neonates with negative reading in conventional magnetic resonance imaging (MRI) (HII-) are rarely reported. Here, we used arterial-spin-labeled perfusion MRI to compare cerebral blood flow among health controls, HII neonates with positive reading of conventional MRI images (HII+) and HII- neonates. The results demonstrate that perfusion is altered in HII neonates even with negative reading of conventional MRI images, suggesting importance of inclusion of perfusion MRI for evaluating HII in clinical practice and research.
Purpose
Brain perfusion plays an important role in the diagnosis and prognosis of neonatal hypoxic ischemic injury (HII), but the studies on the perfusion changes in HII neonates with negative findings on conventional MRI are rarely reported. We hypothesized that the perfusion changes can be found in HII neonates even with negative readings on conventional MRI images including diffusion-weighted (DWI) and T1/T2-weighted images. In this study, brain perfusion changes were quantified by the pulsed arterial spin labeling (ASL) perfusion MRI. Pulsed ASL was acquired from 69 neonates including healthy controls (HC), HII neonates with positive MRI reading (HII+) and HII neonates with negative MRI reading (HII-). We aimed to compare cerebral blood flow (CBF) measurements calculated from the ASL data among the 3 groups to evaluate possible CBF alterations in both HII+ and HII- groups.Methods
Data acquisition: ASL perfusion data of 18 HC neonates (10 male and 8 female, 12.3±6.7 days), 31 HII+ neonates (15 male and 17 female, 9.1±7.6 days) and 20 HII- neonates (12 male and 8 female, 8.7±4.1 days) were identified for conducting the retrospective case-control study following an IRB approved protocol. Cases were defined according to clinical diagnosis of HII on medical record and conventional MRI reading. Controls were neonates with normal reading on conventional MRI imaging and absence of neurological alterations during clinical care and follow-up. The pulsed ASL images were acquired on a 3T Siemens Magnet on Skyra scanner with perfusion model of PICORE Q2T using the following parameters: bolus time Tl1=700ms, inversion time T1=1800ms, TR/TE=2600/14ms, 14 slices, FOV=200x200mm, 64x64 matrix, voxel size=2.8x2.8x6.0mm3, flip angle=900, 45 label/control image pairs. The T2-weighted structural image (T2w) was also acquired.
Image preprocessing: ASL data processing toolbox (ASLtbx) was adopted for ASL data preprocessing1. Motion correction by rigid registration was used to align ASL data to the mean ASL image, temporal-spatial smoothing was performed to prevent noise propagation, perfusion weighted images were computed by subtracting the time-averaged signal intensities of control and label images, outlier cleaning2 was applied after the perfusion subtraction to remove outlier ASL acquisition timepoints.
CBF quantification: The CBF map for pulsed ASL data was calculated by applying the single-compartment ASL mode3. Specifically, the equilibrium magnetization of blood M0b was estimated based on the cerebrospinal fluid (CSF) with parameters Rcsf=0.87, T2csf=250ms, T2b=90ms, TE=14ms and M0csf computed by the average intensity of CSF on the proton density-weighted reference image M04. The extraction of CSF on reference image M0 was performed by first applying a threshold on T2w and then mapping it to M0 image space. The other parameters for CBF quantification was listed as follows: blood-brain partition coefficient λ=0.9, T1-blood=1650ms, labeling efficiency α=0.98.
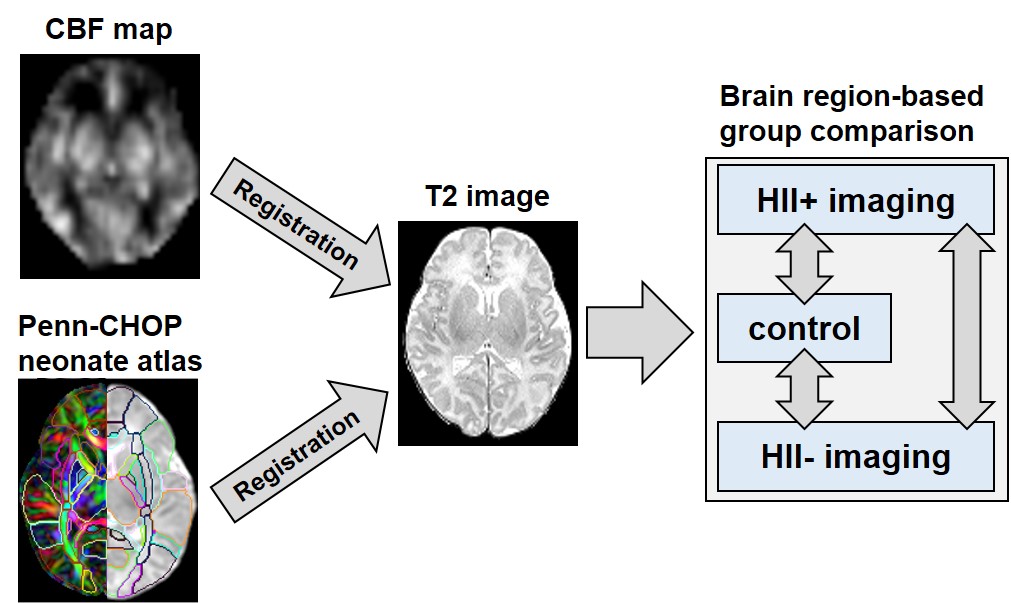
Statistical analysis: A Penn-CHOP neonate brain atlas5 was adopted to identify brain regions for statistical comparison among HC, HII+ and HII- groups. Specifically, both the CBF map and the Penn-CHOP neonatal atlas were aligned to the subject native T2w space to extract the averaged regional CBF values, and group comparison was then performed by permutation test for biomarker identification as shown in Fig 1.
Results
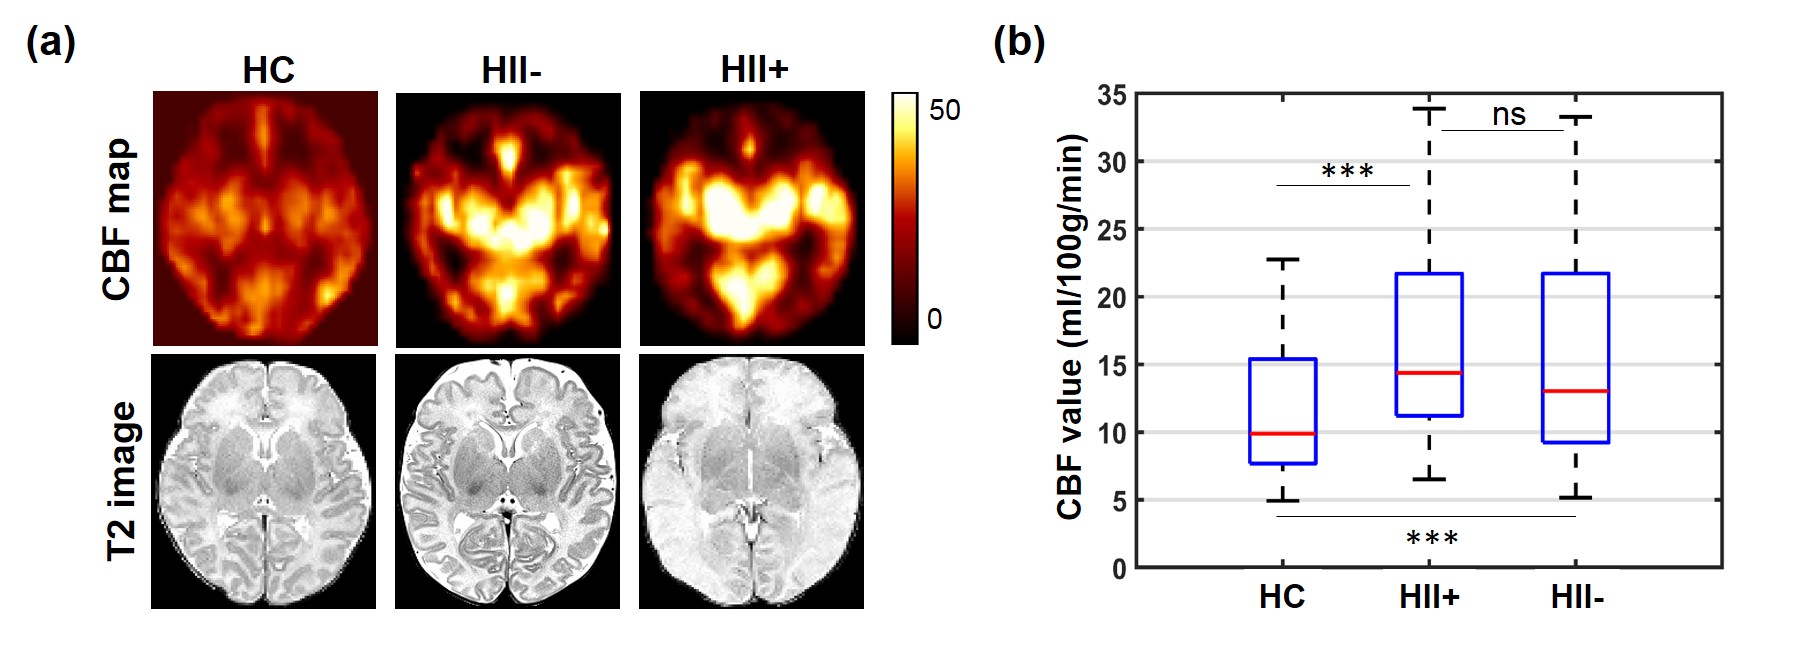
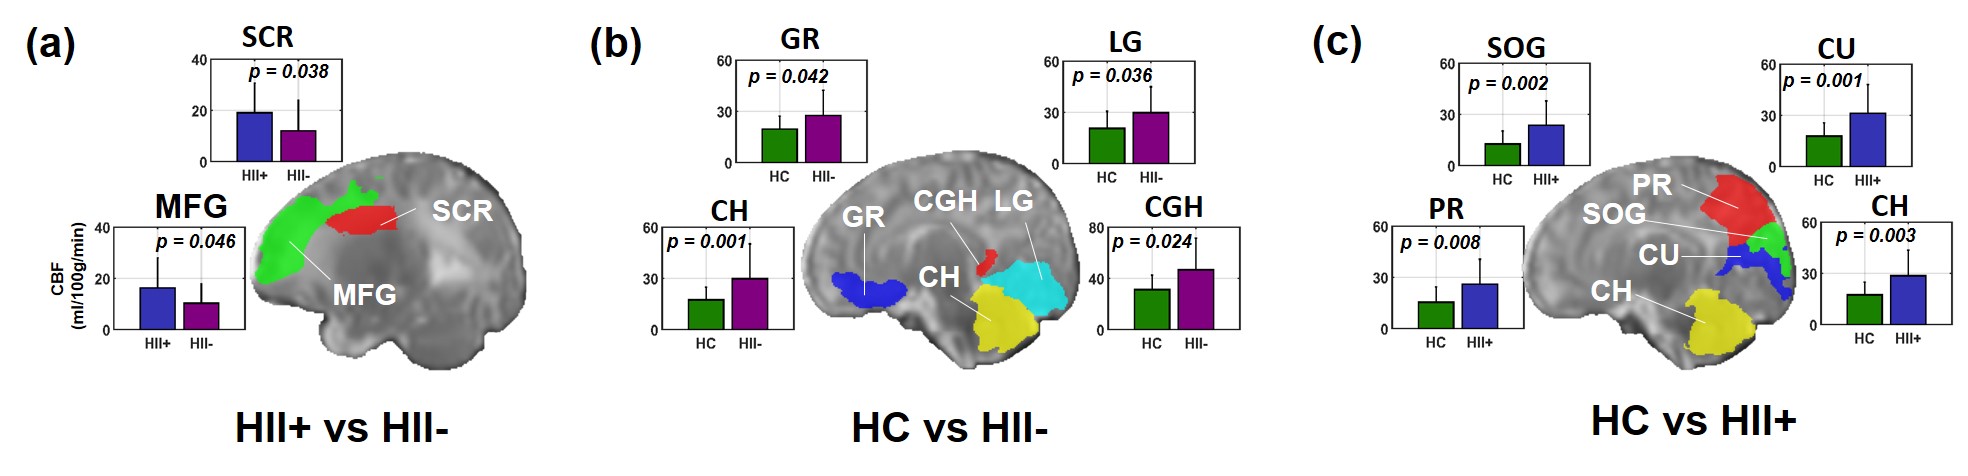
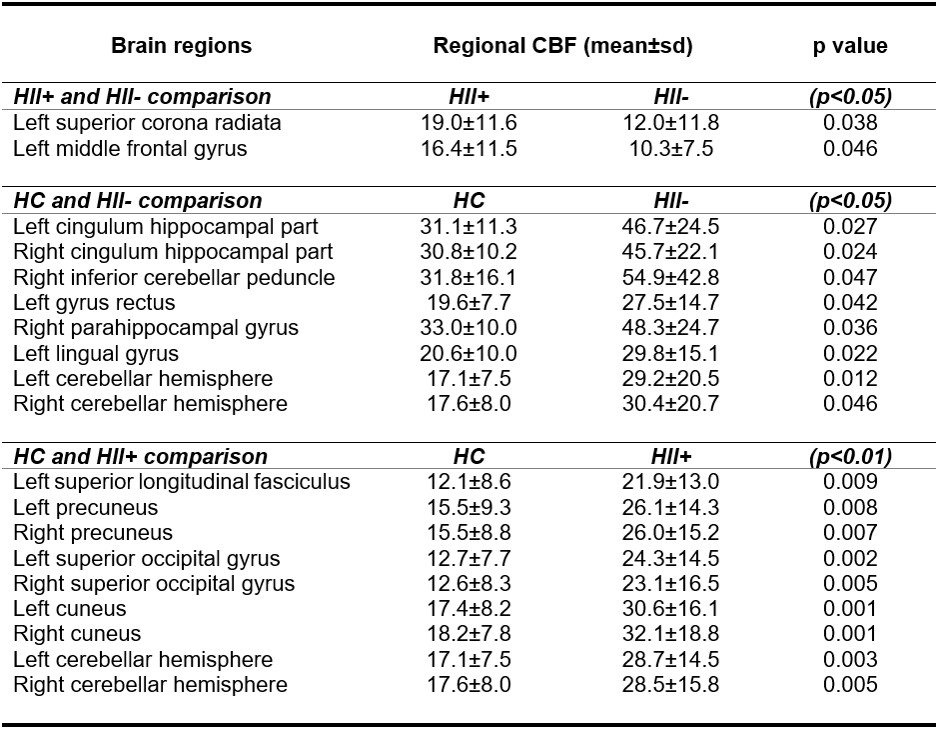
The results demonstrate CBF changes not only in HII+ but also HII- group. Both the regional CBF maps and structural T2w of 3 representative subjects from HC, HII- and HII+ groups are shown in Fig 2a with perfusion changes in signal intensity. Fig 2b compares the whole brain averaged perfusion changes of all subjects among 3 groups. Significant differences in perfusion were found in HC vs HII+ and HC vs HII- groups; however, no significant differences in perfusion were found for the HII+ vs HII- group. Fig 3 demonstrates group differences in regional CBF. The mean and standard deviation values of identified brain region with significant perfusion differences, and comparison p values are also shown in the bar plots. The details of identified brain regions with significant perfusion differences (p<0.05) among 3 groups can be found in Table 1.Discussion and Conclusion
Our data shows that CBF is significantly higher in HII- group compared with HC group, suggesting importance of inclusion of perfusion MRI for evaluating HII in clinical practice and research. The absence of significant difference between HII+ and HII- groups implies that there is ongoing reperfusion response in the HII- group which has important therapeutic and prognostic implications. Whether perfusion-based imaging will help monitor reperfusion response and ongoing injury, and may serve as a better tool for therapeutic guidance and prognosis, warrants further study in correlation with long-term outcomes.Acknowledgements
This study is funded by NIH MH092535, MH093525-S1 and HD086984.References
[1] Wang Z, Aguirre GK, Wang J, et al. Empirical optimization of ASL data analysis using an ASL data processing toolbox: ASLbox. Magnetic Resonance Imaging, 2008; 26: 261-269
[2] Wang Z, Das SR, Xie SX, et al. Arterial spin labeled MRI in prodromal Alzheimer’s disease: A multi-site study. NeuroImage: Clinical, 2013; 2: 630-635
[3] Alsop DC, Detre JA, Golay X, et al. Recommended implementation of arterial spin-labeled perfusion MRI for clinical applications: A consensus of the ISMRM perfusion study group and the European consortium for ASL in demintia. Magnetic Resonance in Medicine, 2014; 73(1): 102-116.
[4] Chen Y, Wang Z, Detre JA. Impact of equilibrium magnetization of blood on ASL quantification. In Proc 19th Annual Meeting ISMRM, Montreal, Canada, 2011.
[5] Feng L, Li H, Oishi K, et al. Age-specific gray and white matter DTI atlas for human brain at 33, 36 and 39 postmenstrual weeks. NeuroImage, 2018, in press.
Figures