0029
Functional MRI-based Deep Learning Classification between Temporal Lobe Epilepsy Patients and Healthy Controls1Biomedical Engineering, University of Wisconsin-Madison, Madison, WI, United States, 2Medical Physics, University of Wisconsin School of Medicine and Public Health, Madison, WI, United States, 3Neurology, University of Wisconsin School of Medicine and Public Health, Madison, WI, United States, 4Neurology, Medical College of Wisconsin, Milwaukee, WI, United States, 5Biophysics, Medical College of Wisconsin, Milwaukee, WI, United States, 6Radiology, University of Wisconsin School of Medicine and Public Health, Madison, WI, United States
Synopsis
Common machine learning approaches to differentiate between Temporal Lobe Epilepsy (TLE) and healthy controls often include extensive preprocessing techniques that often entail feature extraction, resulting in a more time-intensive and variable approach. Utilizing data from both the Epilepsy Connectome Project (ECP) and Human Connectome Project (HCP), this study attempts to develop, train, and validate a deep learning classifier to automatically differentiate between TLE patients and healthy subjects using resting-state fMRI (rs-fMRI) and task fMRI (t-fMRI) data alone without advanced preprocessing steps or feature extraction.
Introduction
Temporal Lobe Epilepsy (TLE) is the most common medical refractory form of epilepsy in adults. The Epilepsy Connectome Project (ECP) examines the differences in connectomes between TLE patients and healthy controls1. Additionally, the Human Connectome Project (HCP) is a compilation of complex datasets from multiple MRI imaging modalities for healthy controls2. Functional Magnetic Resonance Imaging (fMRI) allows us to investigate brain disruption in TLE patients through functional connectivity analyses that show us how brain regions interact with each other3. Utilizing data from both the ECP and HCP, this study attempts to develop, train, and validate a deep learning classifier to automatically differentiate between TLE patients and healthy subjects using resting-state fMRI (rs-fMRI) and task fMRI (t-fMRI) data.Methods
Resting-state and task-based fMRI data from 78 TLE patients and 76 healthy controls were obtained from both the Epilepsy Connectome Project (ECP) and Human Connectome Project (HCP) datasets [ECP, n = 78 patients, 47 controls; HCP, n= 29 controls; combined total, n=154 subjects]. The ECP MRI images were acquired on a 3T GE MRI scanner (GE Healthcare Discovery MR750, Waukesha, WI) using a Nova 32-channel head coil. Resting-state fMRI and t-fMRI data was acquired using an echo planar imaging sequence, TR = 802 ms, TE = 33.5 ms, FOV = 20.8 cm, flip angle = 50°, 72 slices, 2 mm isotropic voxels, and multi-band acceleration factor of 8. The HCP MRI images were acquired using a customized Siemens Skyra 3T scanner. The rs-fMRI and t-fMRI scans were performed using a Gradient-echo EPI sequence, TR = 720 ms, TE = 33.1 ms, FOV = 208 x 180 mm, flip angle = 52°, 72 slices, 2 mm isotropic voxels, and multi-band acceleration factor of 8. All images were preprocessed using the minimal pre-processing pipelines for the Human Connectome Project2. A total of 2 RS-fMRI sessions (5 minutes per session) and 3 t-fMRI (tasks: emotion, language, and social) sessions were used for the purpose of this study. Using the AFNI based “@ROI_Corr_Mat” program ROI correlation matrices for each subject, and each rs-fMRI and t-fMRI session, were obtained by using the brain parcellation proposed by Gordon et. al4. Due to the symmetry of the acquired matrices (333 x 333 elements), only the upper half of the matrix excluding the diagonal was used. Elements from the upper half of each symmetric matrix were then reshaped into a 1D array. Three methods of concatenating the data were employed: (1) Composed of only rs-fMRI scans in which two rs-fMRI scans for a single subject were concatenated into a single row and placed into a 154 x 110,556 element matrix; (2) Composed of only t-fMRI scans in which three t-fMRI scans for a single subject were concatenated into a 154 x 165,834 element matrix; (3) Composed of all scans (RS-fMRI and t-fMRI) for a single subject concatenated into a 154 x 276,390 element matrix
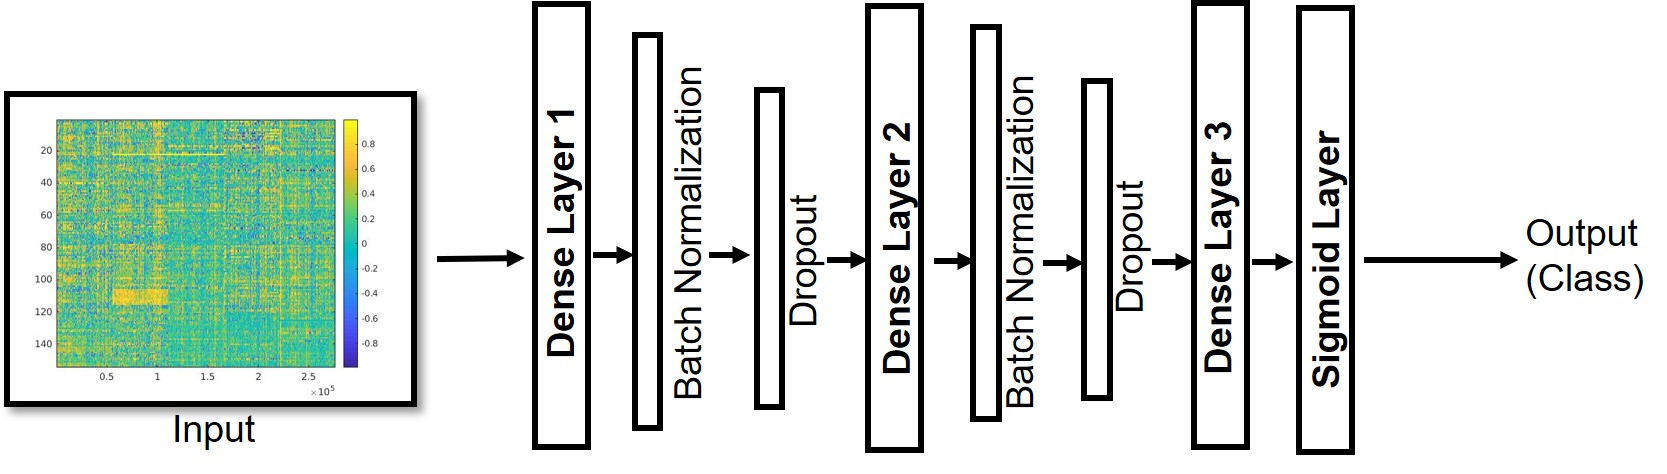
A deep learning dense model was built in Keras (Fig. 1) to classify between TLE patients and healthy controls using rs-fMRI and t-fMRI correlation based data. A stratified 10-fold validation was performed in which 123 subjects were randomly included in the training dataset, 16 in the test dataset, and 15 in the validation dataset. Training was performed on a GPU workstation using 500 epochs and a batch size of 10. Training required between 1-2 hours, and evaluation required less than 1 ms.
.
Results
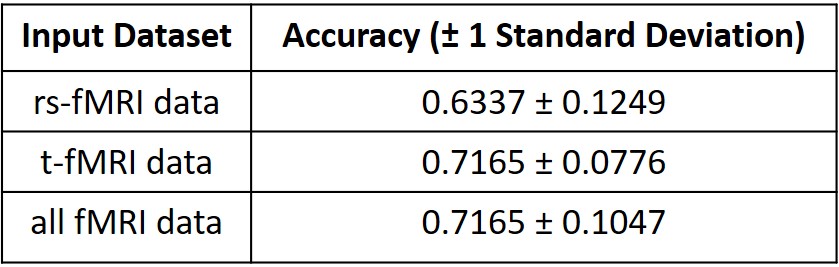
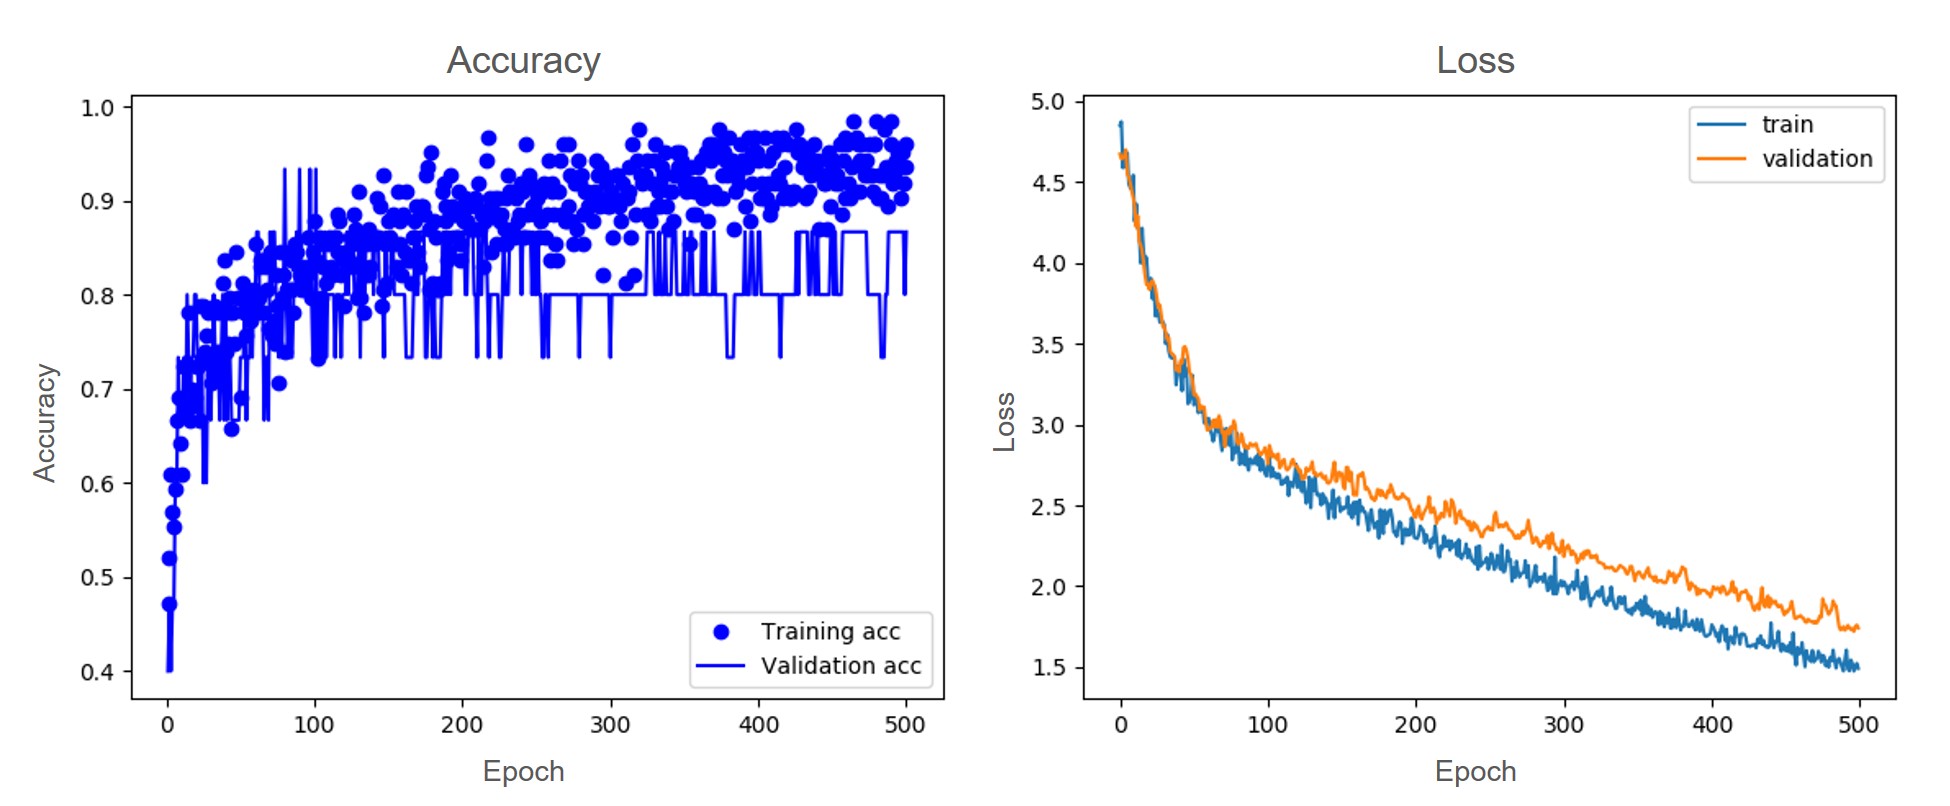
The classification accuracies (with standard deviations) for the deep learning dense model were: for only rs-fMRI data: 0.6337 ± 0.1249, for t-fMRI data:0.7165 ± 0.0776, and for rs-fMRI and t-fMRI data combined: 0.7165 ± 0.1047 (Fig. 2). Representative plots of accuracy and loss for a single fold are presented in figure 3.Summary & Discussion
In this study, we trained, validated, and tested a simple deep learning model to classify between TLE patients and healthy subjects using fMRI data. We trained the network architecture multiple times using three different input datasets: rs-fMRI only, t-fMRI only, and all fMRI data. The mean accuracy and standard deviation of the models after performing a stratified 10-fold cross validation demonstrated reasonable accuracy with no requirement of feature engineering. Common machine learning approaches to differentiate between TLE and healthy controls often include extensive preprocessing techniques that often entail feature extraction, resulting in a more time-intensive and variable approach. The results of this study demonstrate that it is possible to differentiate between TLE patients and healthy subjects by providing minimally-processed fMRI data alone to the model without advanced preprocessing steps or feature extraction.Acknowledgements
The project described was supported by the Clinical and Translational Science Award through the NIH National Center for Advancing Translational Sciences grant TL11TR002375. The content is solely the responsibility of the authors and does not necessarily represent the official views of the NIH.References
1. Cook, C. J. et al. Effective Connectivity Within the Default Mode Network In Left Temporal Lobe Epilepsy: Findings from the Epilepsy Connectome Project. Brain Connect. brain.2018.0600 (2018). doi:10.1089/brain.2018.0600
2. Glasser, M. F. et al. The Minimal Preprocessing Pipelines for the Human Connectome Project. Neuroimage 80, 105–124 (2013).
3. Maneshi, M. et al. Specific resting-state brain networks in mesial temporal lobe epilepsy. (2014). doi:10.3389/fneur.2014.00127
4. Gordon, E. M. et al. Generation and Evaluation of a Cortical Area Parcellation from Resting-State Correlations. (2014). doi:10.1093/cercor/bhu239
Figures