0027
A deep learning framework with redundancy removal and its diagnostic performance of Parkinson's disease1Medical Imaging and Radiological Sciences, Chang Gung University, Taoyuan, Taiwan, 2School of Information and Communication Engineering, University of Electronic Science and Technology of China, Chengdu, China, 3Neurology, Chang Gung Memorial Hospital, Taoyuan, Taiwan, 4Diagnostic Radiology, Keelung Chang Gung Memorial Hospital, Keelung, Taiwan
Synopsis
Computer-aided diagnosis using deep learning methods shows its potential in medical images classifications. This study aims to examine the diagnostic performance of diffusion tensor imaging using a 4-steps framework for deep learning to differentially diagnose patients with Parkinson's disease(PD) and normal controls(NC).
Introduction
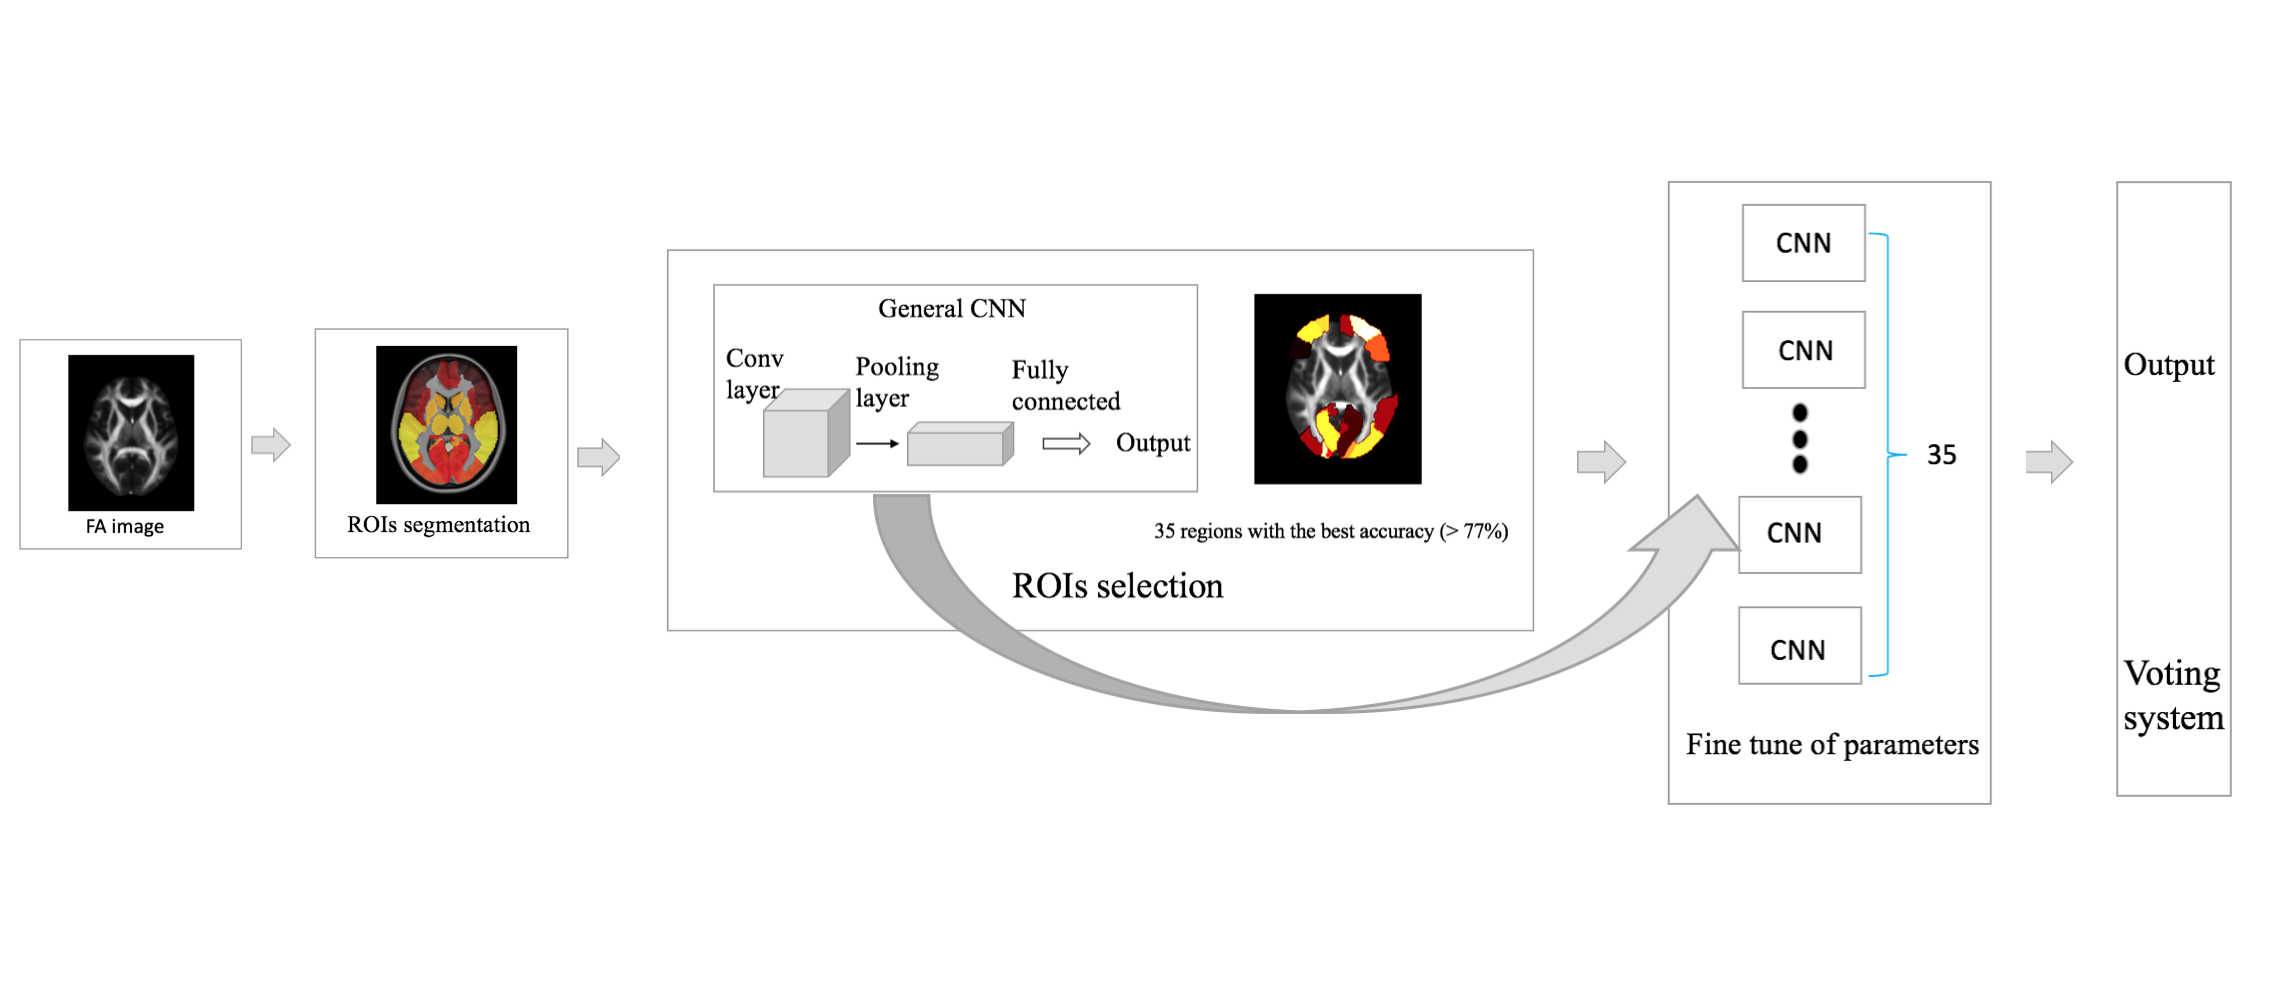
Computer-aided diagnosis using deep learning methods raise great interest in medical image classifications [1]. The advantage in applications to PD is to reduce the potential overfitting from the convolution neural network (CNN). In this study, we proposed a 4-steps framework for deep learning based detection on PD, consisted of segmentation and selection of regions-of-interest (ROIs), fine tuning of network parameters and combination of models, in order to remove the redundant brain regions in a hope to improve the diagnostic accuracy on PD by using diffusion tensor imaging.
Materials and Methods
Diffusion weighted imaging (DWI) with the whole brain coverage were acquired from 337 PD patients (aged 60.0 ± 9.1 years old) and 220 NC subjects (aged 61.0 ± 7.1 years old) using a 3T scanner. Three different imaging protocols using the following parameters were included: TR=5700/8200/7800ms; TE=108/96/83ms, voxel size=2*2*2/2*2*3/2*2*2mm3,b=0 and 1000s/mm2, 30/64/64 directions.). The structure of the deep learning framework was presented in Fig 1. In ROIs segmentation, the procedure followed Lu et al (ref). In short, Fractional Anisotropy (FA) were calculated and parcellated into 116 regions of interest based on the Automatic Anatomic Labeling template. A general CNN architecture was applied to all the ROIs. For the accuracies of most ROIs range from 70% to 77%, We chose to utilize 77% of accuracy as a threshold, 35 regions with the best accuracy (>77%) were selected into the fine-tuned CNNs. The final model was created by combination of the finely-tuned models using a voting system. The prediction results of the framework are the results of more than half of the sub-regional models. The findings were further validated by using 10-fold cross-validation.
Results
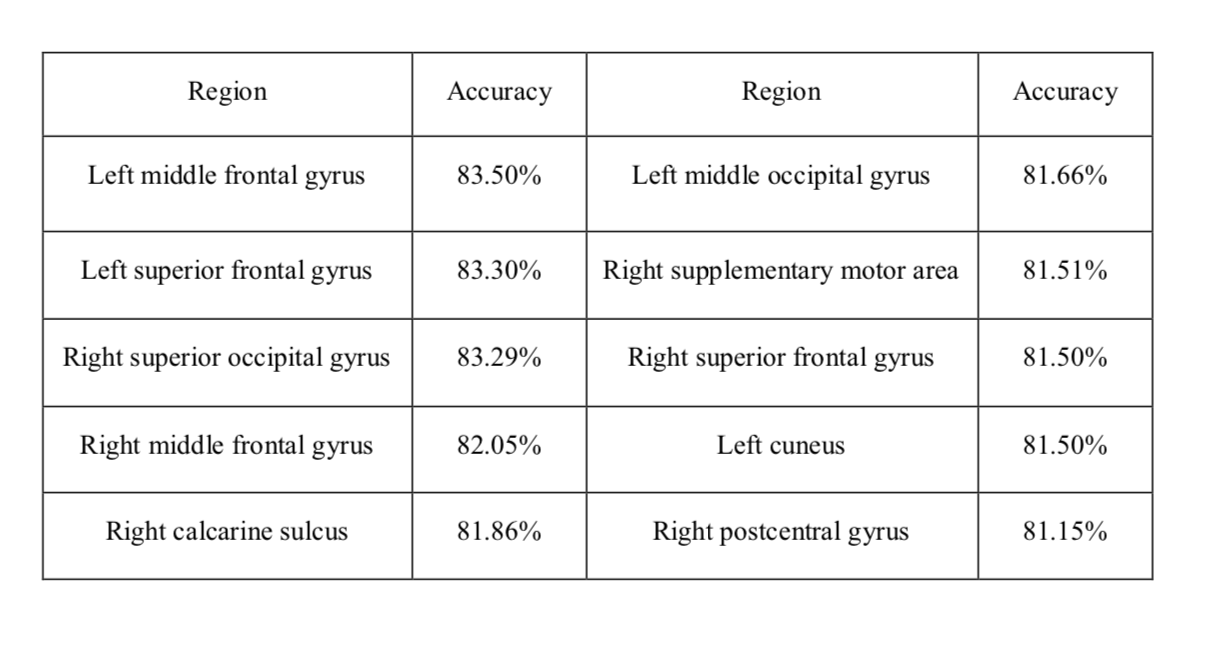
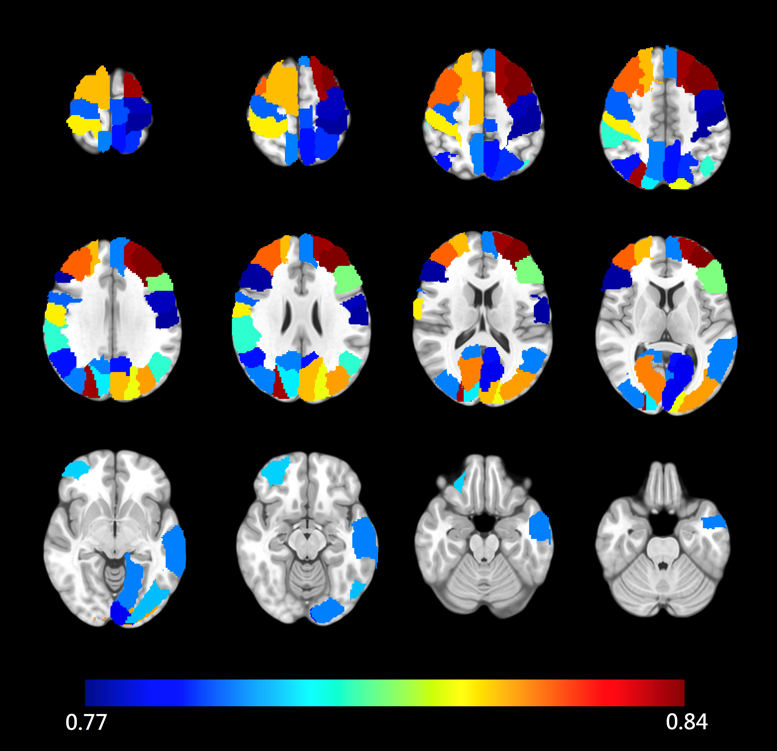
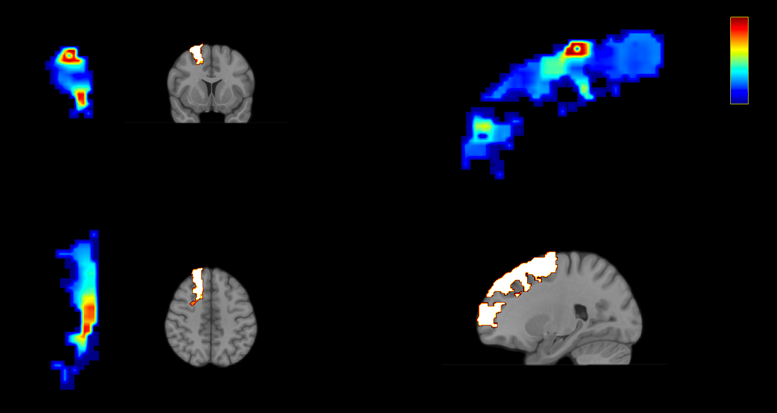
Table 1 shows the accuracy ofonly the top-10 models of ROIs. Among the top-35 models of ROIs which were entered into a fine-tuning framework, 12 single-region achieved better than 80% of accuracy. After fine tuning, the highest accuracy was of 83.50% from the left middle frontal gyrus. The final diagnostic accuracy of the framework achieved 92.5%. Fig 2 showed the spatial distribution of these selected ROIs. In Fig 3, we additionally showed the hot maps to present the important components of right superior frontal gyrus for diagnostic accuracy.Discussion and Conclusion
A large number of redundant features will lead machine learning modesl to learn the wrong information and make it over-fitting, especially in PD diagnosis with a small sample number. The ROIs segmentation and selection in the proposed framework can remove less efficient ROIs. This study not only provided objective evidence that could distinguish patients with PD and NC with good accuracy using diffusion tensor imaging but also proposed a general framework for computer-aided diagnosis of neurodegenerative diseases.Acknowledgements
No acknowledgement found.References
[1] GeertLitjens, ThijsKooi, BabakEhteshamiBejnordi, Arnaud Arindra Adiyoso Setio, Francesco Ciompi, Mohsen Ghafoorian, Jeroen AWM van der Laak, Bram Van Ginneken, and Clara I Sánchez, “A survey on deep learning in medical image analysis,” Medical image analysis, vol. 42, pp. 60–88, 2017.Figures