0019
MR IMAGE RECONSTRUCTION FROM UNDERSAMPLED k-SPACE USING DEEP LEARNING1Radiology, University of Texas Southwestern Medical Center, Dallas, TX, United States
Synopsis
This work presents a deep learning approach to reconstruct MR images from undersampled k-space on 3D-FLAIR MR images. IR-net, a patch based 3D-Dense U-net, was designed to achieve this. 600 [JM1] [CGBY2] 3D-FLAIR MR images were used for training and testing. Aliased images were created by undersampling the high resolution 3D-FLAIR images in k-space using a Poisson distribution filter. The network was trained on patches from 550 aliased k-space data with their corresponding high resolution 3D-FLAIR MR images as ground truth and 50 images were held out for testing. IR-net successfully reconstructed the aliased images with significant improvement in SSIM and PSNR. [JM1]Are these 600 image slices, or 600 3D image volumes? [CGBY2]600 3D images.
INTRODUCTION
Accelerated acquisitions such as parallel imaging and compressed sensing (CS) using undersampled k-space is routinely used in the current clinical practice to shorten acquisition times [1]. While these accelerated images are successfully reconstructed by various complicated algorithms, the images often suffer from reduced signal to noise ratio (SNR) and residual aliasing. Some of the reconstruction algorithms operate in k-space, however, there are several algorithms that first reconstruct the images using the standard fast Fourier transformation (FFT) from the undersampled k-space, followed by unaliasing [2]. Recently, deep learning methods using convolutional neural networks (CNNs) have been developed for medical image analysis including segmentation and classification. In this work, we developed and evaluated such a deep learning model using a 3D Dense U-net to perform the image unaliasing from the undersampled k-space.MATERIALS & METHODS
600 3D FLAIR images of the brain from male football players (age: 9-18 years) acquired as part of the iTAKL study of subconcussive impacts [3] were used. All FLAIR images were 3D acquisitions in sagittal orientation with 1 mm isotropic resolution and a matrix size of 160x232x256. For the initial testing of the 3D Dense U-net, the k-space data was generated from these images using standard two-dimensional fast Fourier transformation (2D FFT) along the right-left (R/L) and anterior-posterior (A/P) directions (i.e. axial orientation), resembling the ky-kz space. A Poisson distribution filter was then generated using approximately 1/5th of the total points in this ky-kz plane to create the undersampled k-space (Fig. 1). Subsequently, this undersampled k-space data was reconstructed using the inverse 2D FFT to create the aliased image. The original 3D FLAIR images served as the ground truth, while the aliased images from the undersampled k-space served as the input to the 3D Dense U-net model. Data preprocessing steps included 1) N4BiasCorrection [4] to remove the RF inhomogeneity and 2) intensity normalization to 0-mean and unit variance. A 3D Dense-Unet model was constructed to learn, recognize and perform unaliasing to reconstruct the final images from the undersampled k-space. A 32x32x32 patch-based training and testing approach was implemented. Out of 600 scans, aliased images from 550 scans along with the corresponding high resolution FLAIR images as ground truth were used for training the networks, and subsequently tested on 50 scans. Structural similarity (SSIM) and peak SNR (PSNR) were computed to evaluate the performance of the 3D Dense U-net model. The architecture of the designed 3D Dense U-net is shown in Fig. 2. Each dense block consisted of four layers with every layer connected to every other layer in that dense block (Fig. 3). The connection type used was concatenation, which means that feature maps from every layer are concatenated to feature maps from every other layer in that dense block. At the end of each dense block, the input to the dense block was also concatenated to the output of that dense block. Each dense block was followed by a transition down block until the bottleneck layer, after which a transition up block precedes a dense block until the final convolution layer, yielding the output. The bottleneck block (Dense block 4 from Fig. 2) was used to avoid the problem of having large convolution layers and to keep the convolution layers to a smaller number.RESULTS
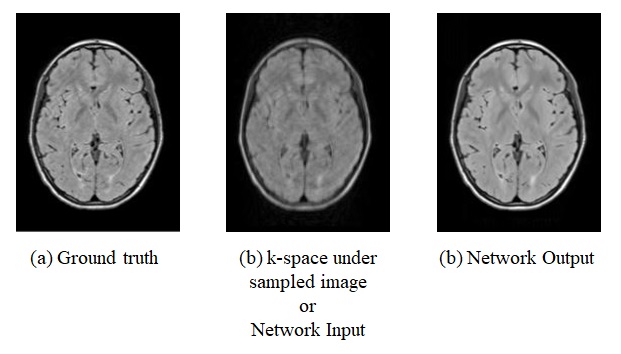
The proposed 3D Dense U-net model successfully reconstructed the aliased images that were similar in appearance to the original FLAIR images (Fig. 4). Across the entire 50 test scans, the SSIM improved to 0.96, compared to 0.65 between the aliased images and the original FLAIR images (Table 1). The model also achieved a PSNR of 52 dB, compared to 36 dB with the aliased image.DISCUSSION & CONCLUSION
We evaluated a deep learning model using a 3D Dense U-net for reconstructing aliased images from undersampled k-space. The network performed well in unaliasing the images and improving the resolution. This model took 3 minutes to generate the final output image. Future studies will compare the model to other accelerated reconstruction methodsand evaluate reconstructing prospectively acquired undersampled k-space data in in normal studies and in brains images with pathology.Acknowledgements
No acknowledgement found.References
1. Saloner, D., J. Liu, and H. Haraldsson, MR physics in practice: how to optimize acquisition quality and time for cardiac MR imaging. Magn Reson Imaging Clin N Am, 2015. 23(1): p. 1-6. 2. Pruessmann, K.P., et al., SENSE: sensitivity encoding for fast MRI. Magn Reson Med, 1999. 42(5): p. 952-62. 3. Davenport, E.M., et al., Abnormal white matter integrity related to head impact exposure in a season of high school varsity football. J Neurotrauma, 2014. 31(19): p. 1617-24. 4. Tustison, N.J., et al., Large-scale evaluation of ANTs and FreeSurfer cortical thickness measurements. Neuroimage, 2014. 99: p. 166-79.Figures