0015
Oxygen-enhanced UTE MRI for Quantification of Dynamic Lung Function1Medical Physics, University of Wisconsin-Madison, Madison, WI, United States, 2Radiology, University of Wisconsin-Madison, Madison, WI, United States, 3Pediatrics, University of Wisconsin-Madison, Madison, WI, United States, 4Biomedical Engineering, University of Wisconsin-Madison, Madison, WI, United States
Synopsis
Three-dimensional dynamic imaging using free-breathing oxygen-enhanced (OE) ultrashort echo time (UTE) MRI can measure change of partial pressure of oxygen (ΔPO2) and wash-in/out time constants. Nine healthy subjects underwent the dynamic OE MRI protocol at 1.5T. A subset of 4 subjects underwent repeated exams and 2 of these 4 underwent the same protocol at 3.0T on the same day. The inter-exam variations at 1.5T suggest good quantitative measurements of lung function and wash-in/out dynamics with variations observed in ΔPO2max. The parametric maps imply comparable wash-in/out time constants and normal ventilation measured at 1.5T vs. 3.0T.
INTRODUCTION
Steady-state oxygen-enhanced (OE) MRI with UTE1 provides ventilation quantification comparable to breath-hold hyperpolarized 3He MRI in cystic fibrosis2. Recently, the feasibility of dynamic imaging to assess regional oxygen (O2) uptake and wash-out in healthy lungs was demonstrated3. This study investigates the repeatability of dynamic OE UTE MRI at 1.5T with comparison between 1.5T vs. 3.0T.METHODS
Nine healthy subjects were enrolled in a HIPAA-compliant study. Seven subjects underwent pulmonary function tests (PFTs). A subset of 4 subjects were each imaged at 2 separate visits ≤5months apart at 1.5T (HDxt, GE Healthcare). Two of these 4 subjects underwent the same dynamic protocol at 1.5T with an 8-channel cardiac coil and 3.0T (MR750, GE Healthcare) with a 32-channel torso coil on the same day. Subjects were positioned supine and breathed freely via a non-rebreather facemask with 21% (normoxic) or 100% O2 (hyperoxic) flowing at 15 L/min throughout the scan.
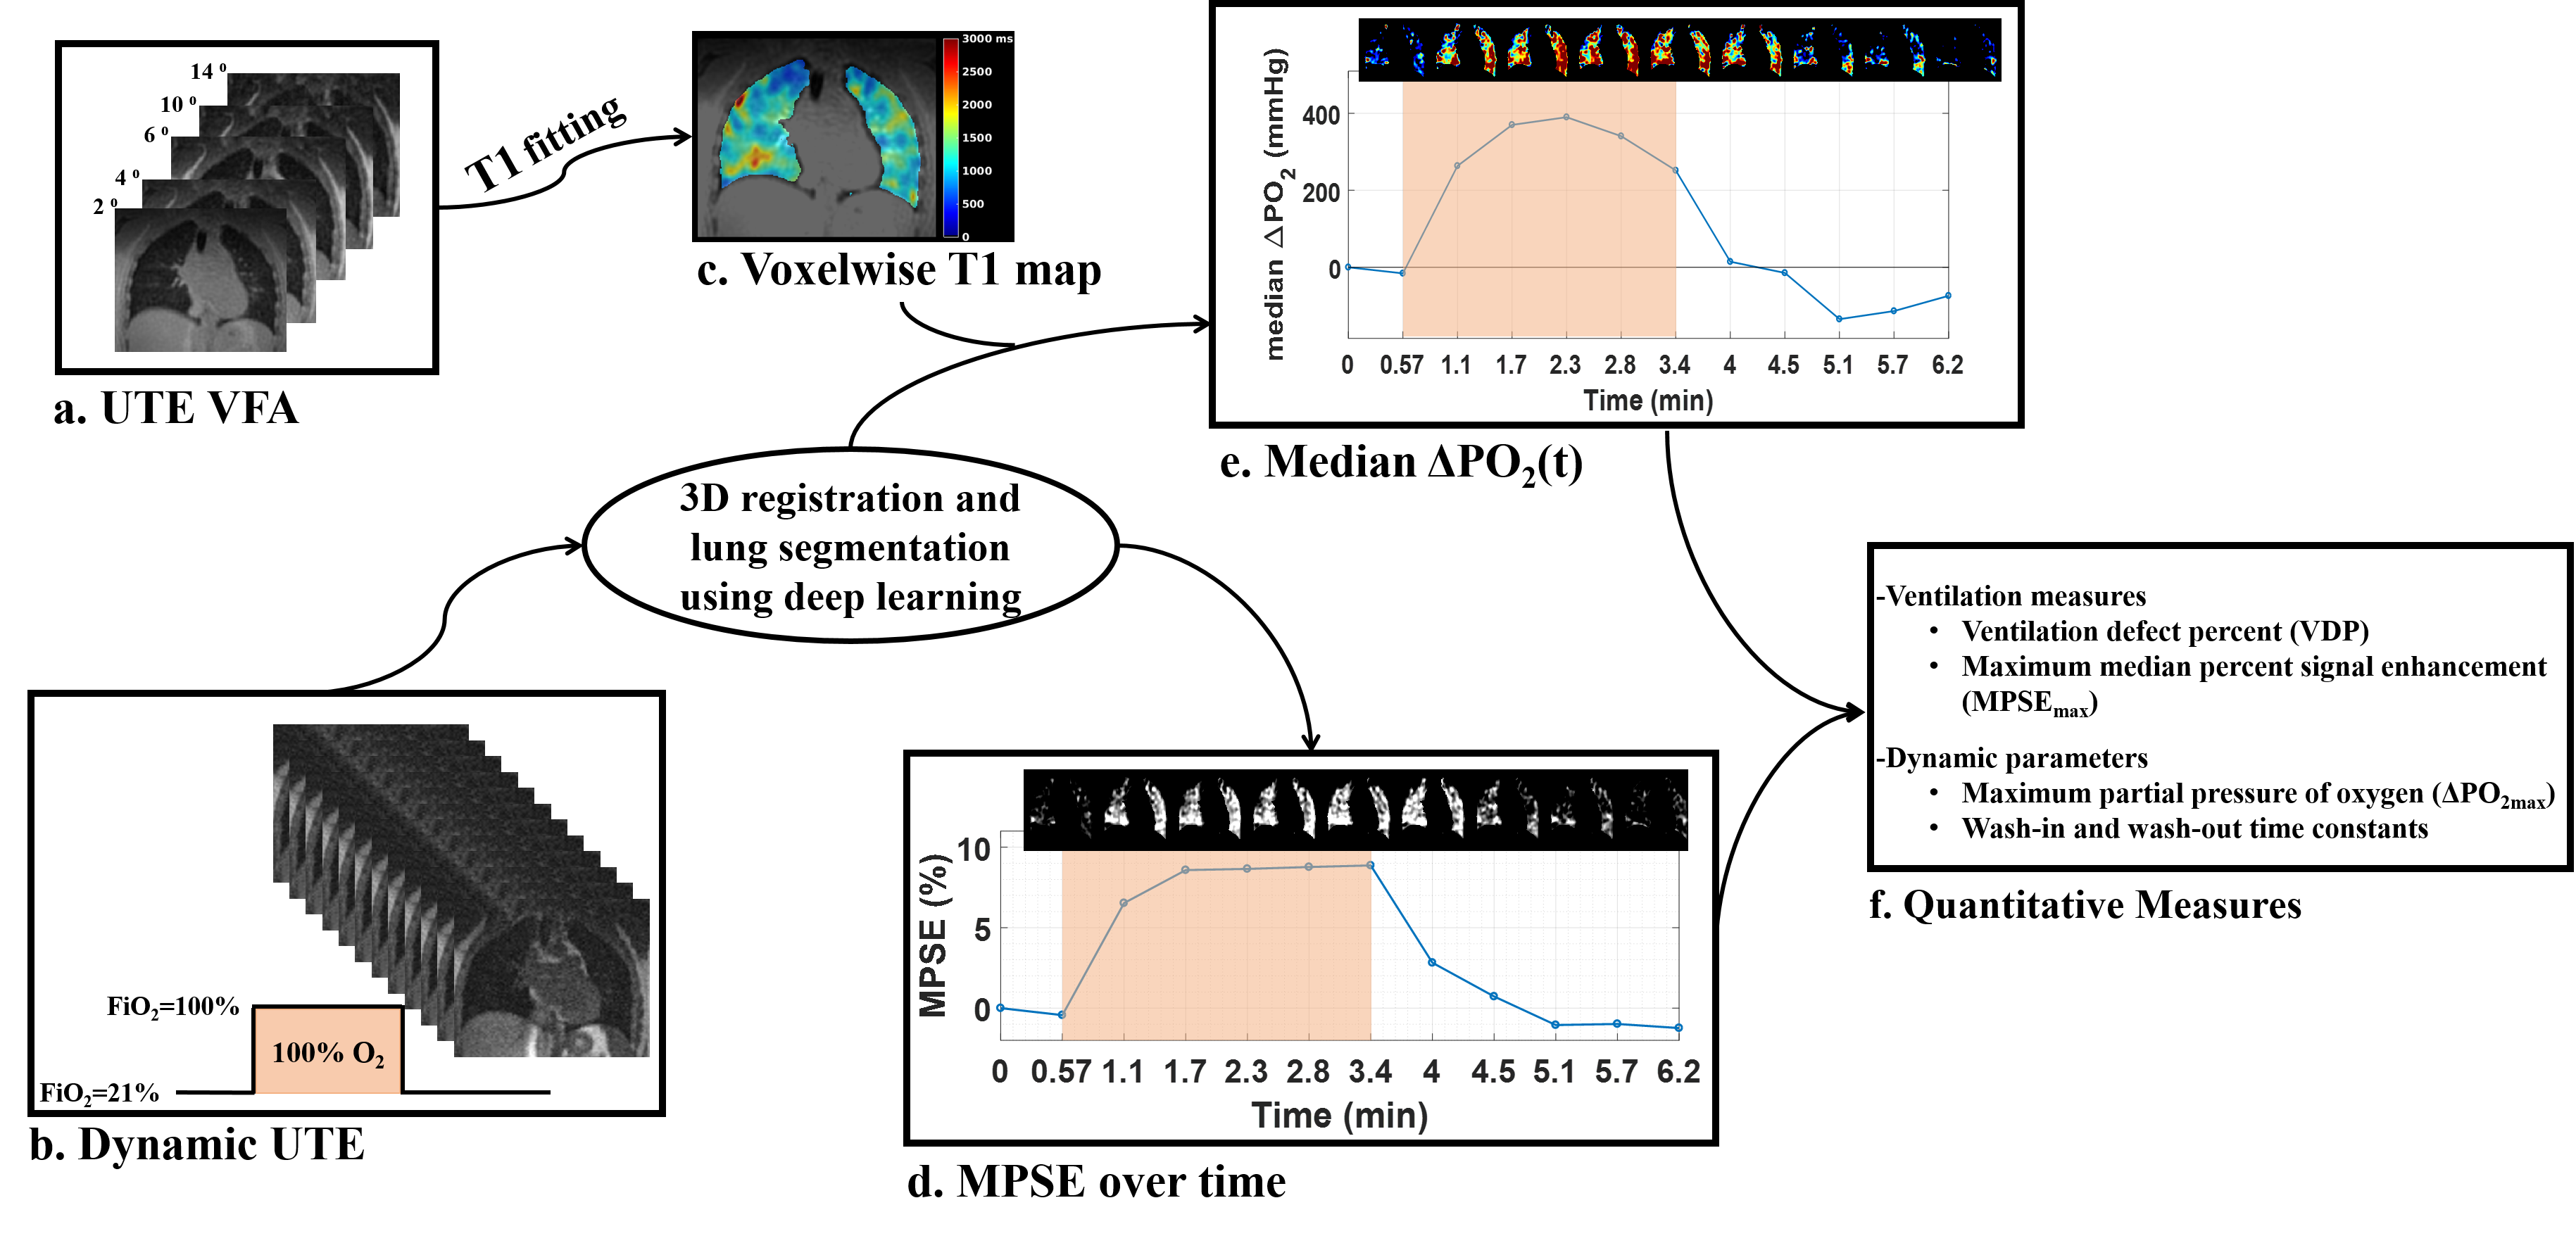
The data and analysis workflow for the dynamic OE UTE MRI3 is illustrated in Figure 1. Each UTE was acquired with 32cm FOV, TE=0.08-0.1ms and prospective gating with a real-time adaptive 50% acceptance window at end expiration. Regional T1 was measured with normoxic UTE variable flip angle (VFA)4: 5 FAs = 2°, 4°, 6°, 10°/9°(1.5T/3.0T), and 14°, TR=2.86 ms, ~30,000 projections per FA, and scan time=~14 minutes. The dynamic scan was a continuous acquisition of 8~18 timeframes with total scan time from 6.8 to 9.3 minutes to cover one cycle of wash-in and wash-out dynamics: subjects breathed 21% O2 for the first 2 timeframes, and then the oxygen concentration alternated between 100% and 21% with 3 (70-second temporal), 5 (34-second) or 8 (24-second) timeframes at each oxygen concentration, FA = 8°/7° (1.5T/3.0T), TR=1.7ms. All UTE images were reconstructed at 1.25mm isotropic for structure and 1cm isotropic for dynamic-function quantification.
A deep learning technique was used to automatically segment lungs volumes5. After registration, the baseline (timeframe#1) T1 was used to estimate $$$T_{1}(t)$$$ at subsequent timeframes to derive the change in partial pressure of oxygen, $$$\triangle PO_{2}(t)=(1/T_1(t)-T_{1baseline})/r_{o2}$$$, where $$$r_{O2}$$$=2.49×10⁻⁴/s mmHg [6]. The O2 wash-in and wash-out portions of $$$\triangle PO_{2}(t)$$$ curves were fitted using exponential functions7, $$$\triangle PO_{2}(t)=\triangle PO_{2max}\times(1-e^{-t/\tau_{up}})$$$ and $$$\triangle PO_{2}(t)=\triangle PO_{2max}\times e^{-t/\tau_{down}}$$$, to compute the time constants ($$$\tau_{up}$$$ and $$$\tau_{down}$$$) respectively, where $$$\triangle PO_{2max}$$$ is the maximum $$$\triangle PO_{2}$$$ after switching air to 100% O2. The maximum intensity projection (MIP) of median percent signal enhancement (MPSE) over hyperoxic-breathing timeframes was used to quantify ventilation defect percent (VDP) automatically8. The repeated measurements of $$$MPSE_{max}$$$ , $$$\triangle PO_{2max}$$$, $$$\tau_{up}$$$ and $$$\tau_{down}$$$ were averaged to calculate the subject group statistics. Bland-Altman analysis with 95% limits of agreement (LOA) was used to evaluate inter-exam variations at 1.5T.
RESULTS
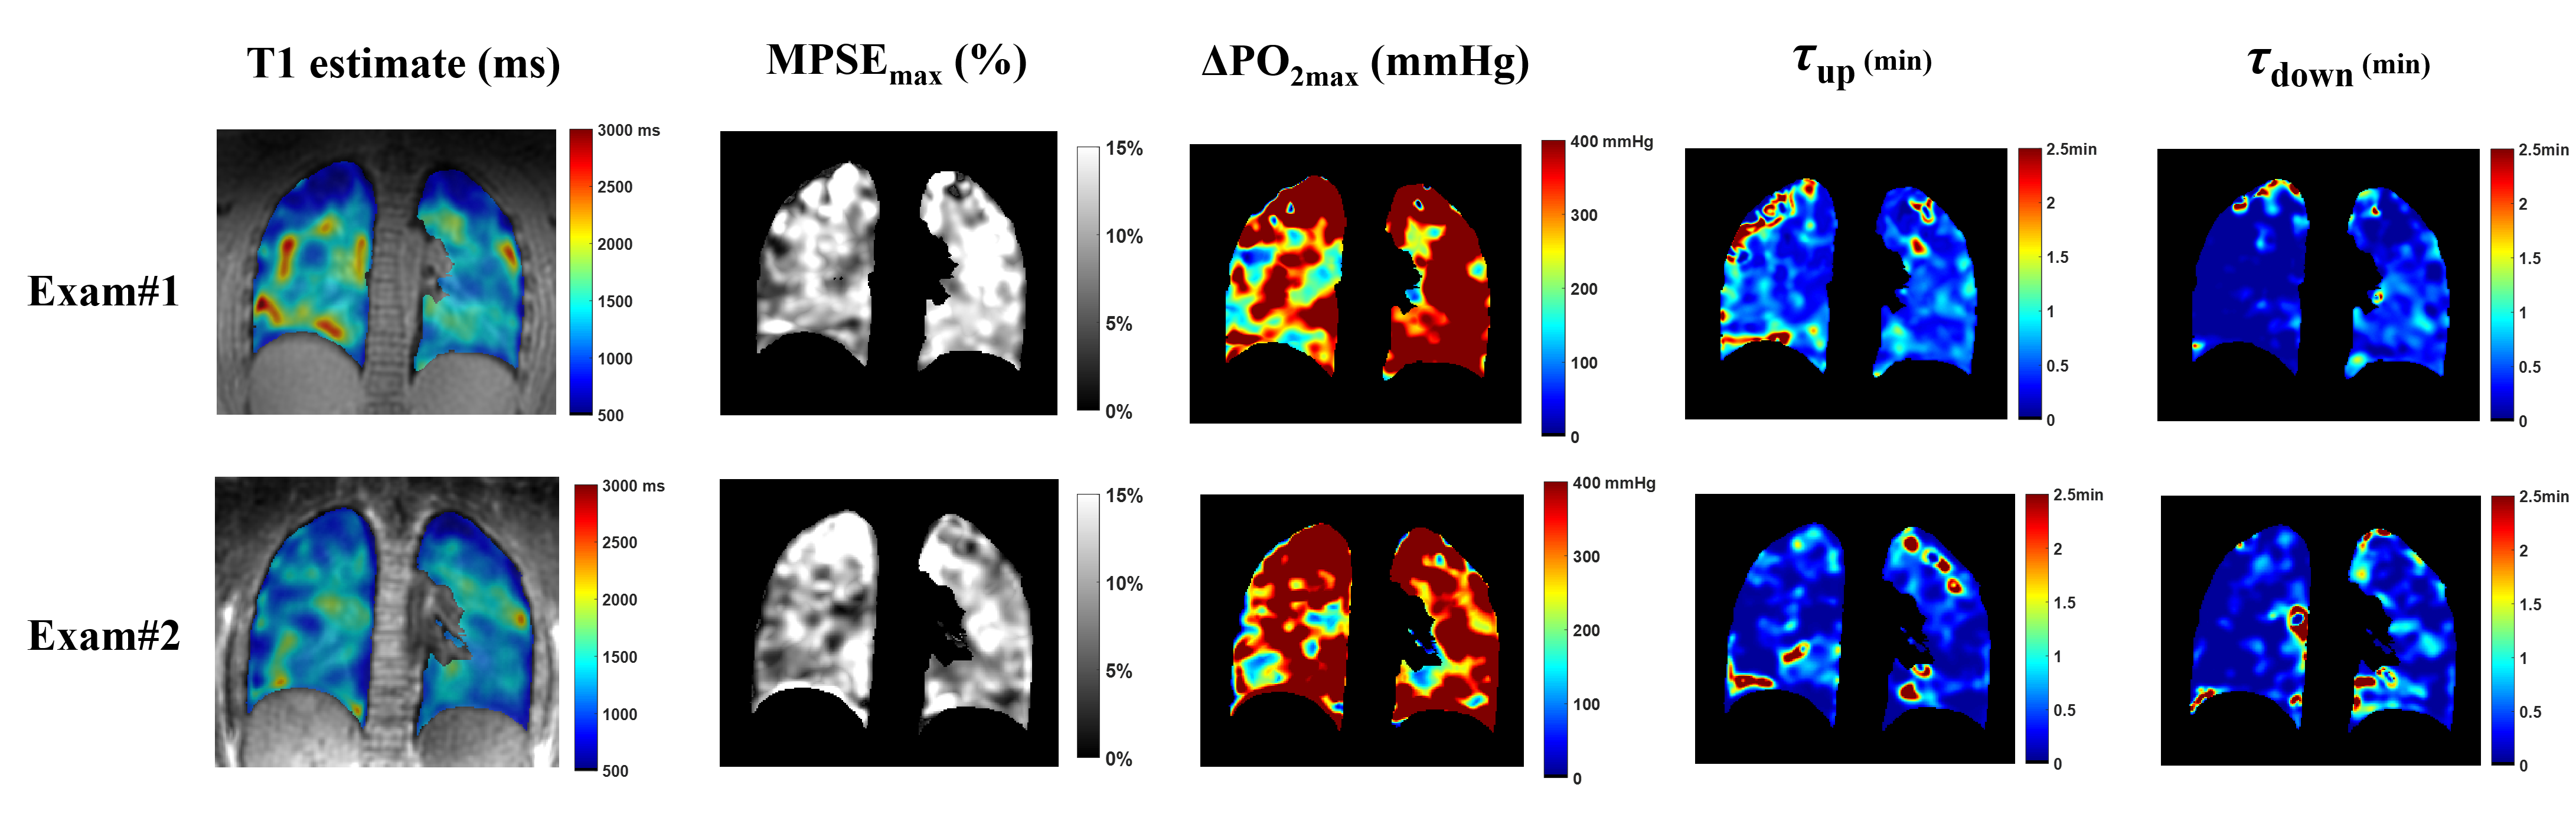
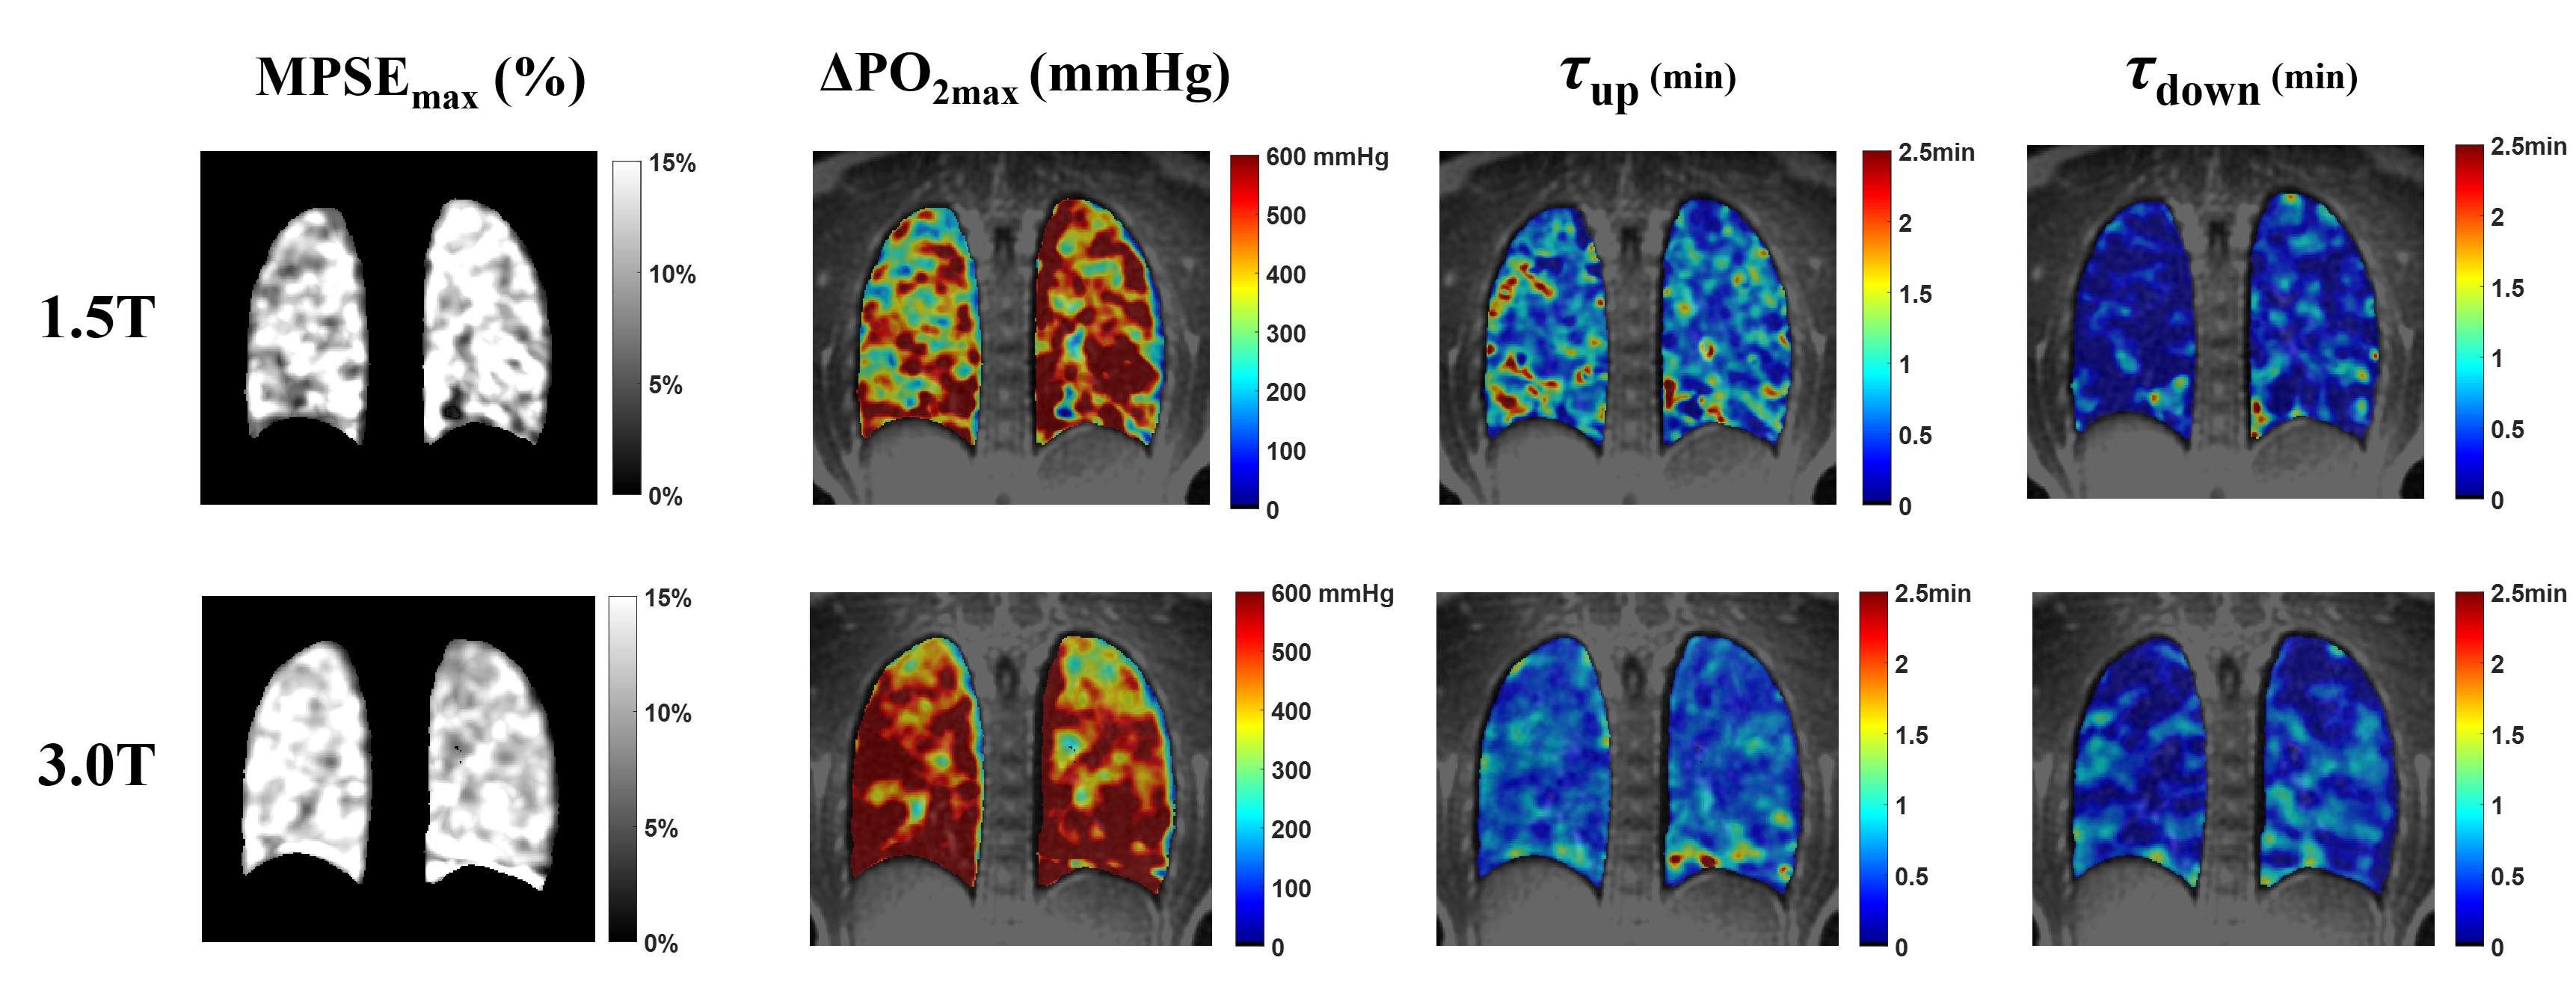
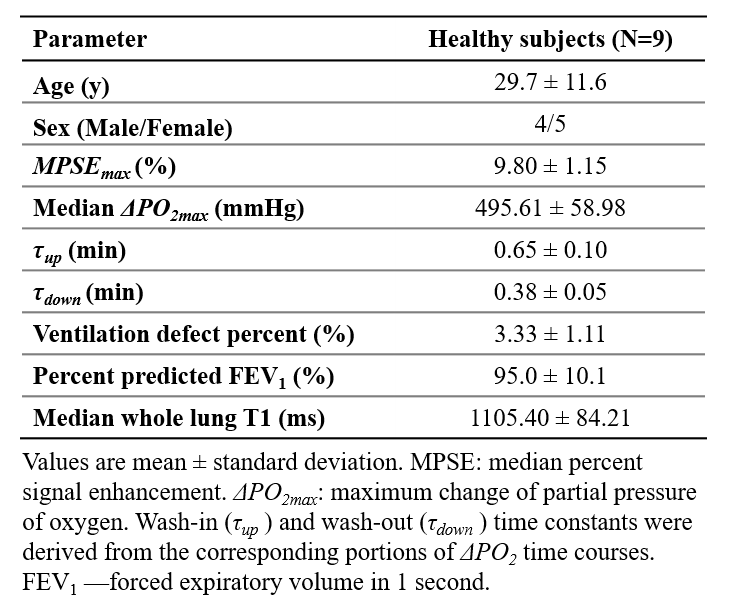
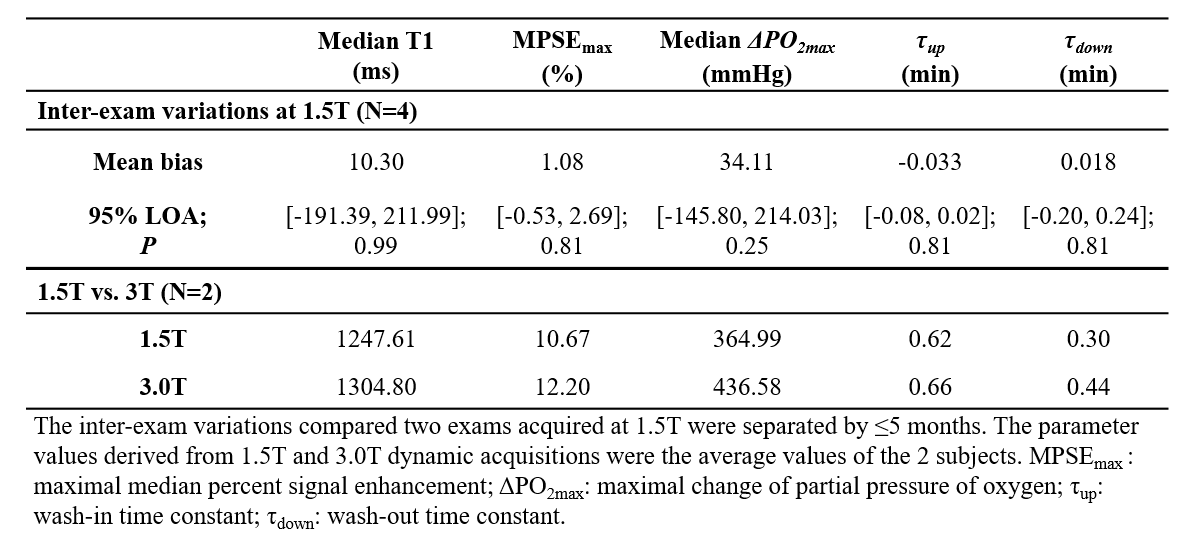
In this healthy cohort, the measured $$$\triangle PO_{2max}$$$ (Table 1) is close to the systemic alveolar PO2 under hyperoxic breathing of ~600mmHg9. The whole lung VDP was 3.3±1.1%, reflecting normal global lung function as evidenced by normal PFTs. The measured $$$\tau_{up}$$$ (0.65min) are significantly longer (P=0.004) than $$$\tau_{down}$$$ (0.38min), which is similar to the 40% smaller $$$\tau_{down}$$$ relative to $$$\tau_{up}$$$ measured using an inversion-recovery OE technique10. The inter-exam comparison (Table 2) showed small variations in $$$MPSE_{max}$$$, $$$\tau_{up}$$$ and $$$\tau_{down}$$$ but notable variations in median $$$\triangle PO_{2max}$$$ (95% LOA=[-145.80, 214.0]mmHg). An example of inter-exam comparison (Figure 2) suggest some regional variations in $$$\triangle PO_{2max}$$$ with relatively homogeneous $$$MPSE_{max}$$$ and time constant maps. The T1, $$$MPSE_{max}$$$ and $$$\triangle PO_{2max}$$$ were larger at 3.0T compared to at 1.5T (Table 2), the estimated $$$\tau_{down}$$$ and $$$\tau_{up}$$$ values each differed by ~0.1min. These parametric maps (Figure 3) imply slightly more heterogeneous regional distributions seen at 1.5T vs. 3.0T.DISCUSSION
Relative to the ~10min steady-state OE1,2,8, the ~7min dynamic acquisition is feasible to extract quantitative ventilation and temporal dynamics of O2 uptake. The wash-in/out dynamics characterized using dynamic imaging are more consistent with steady-state pulmonary physiology and may capture slow-filling regions11. Despite the limited sample size and varying temporal resolutions used, our repeatability analysis found good inter-exam agreement for MPSE, $$$\tau_{up}$$$ and $$$\tau_{down}$$$. The regional heterogeneity in $$$\triangle PO_{2max}$$$ maps may be due to B1 inhomogeneity and consequent regional T1 variations. Future work will seek to estimate T1 and B1 using a deep learning-based MANTIS framework12, improve SNR and temporal resolution of the dynamic acquisitions13 and perform a more rigorous repeatability study at 3.0T.CONCLUSION
The dynamic OE UTE MRI demonstrates the capability for quantification of dynamic lung function with good initial repeatability at 1.5T and comparable performance at 3.0T vs. 1.5T for MPSE, $$$\tau_{up}$$$ and $$$\tau_{down}$$$. $$$\triangle PO_{2}$$$ measures were more variable and remain an area of ongoing development.Acknowledgements
We acknowledge the support in part by grant UL1TR000427 to UW ICTR from NIH/NCATS, Research and Development Fund from Departments of Radiology and Medical Physics, University of Wisconsin-Madison, and grant support from GE Healthcare. We also acknowledge the research technologists who supported the MRI scanning in this work, including Kelli Hellenbrand, RT, Jenelle Fuller, RT, and Sara John, RT.References
[1] Kruger SJ, Fain SB, Johnson KM, Cadman R V, Nagle SK. Oxygen-enhanced 3D Radial Ultrashort Echo Time Magnetic Resonance Imaging in the Healthy Human Lung. NMR Biomed 2014;27:1535–41. doi:10.1002/nbm.3158.
[2] Zha W, Nagle SK, Cadman R V, Schiebler ML, Fain SB. 3D Isotropic Functional Imaging in Cystic Fibrosis Using Oxygen-enhanced MRI: Comparison with Hyperpolarized Helium-3 MRI. Radiology 2018. doi: 10.1148/radiol.2018181148
[3] Zha W, Cadman R V., Hahn AD, Johnson KM, Fain SB. Dynamic 3D Isotropic Resolution Imaging of Human Lungs Using Oxygen-enhanced Radial UTE MRI. Abstr #4147, 26th ISMRM Paris, France 2018.
[4] Bell LC, Johnson KM, Fain SB, Kruger SJ, Nagle SK. T1 <apping of the Lungs Using DESPOT1 Approach with 3D Radial UTE Acquisition. Abtract# 4234 20th ISMRM Melbourne, Aust 2012.
[5] Zha W, Fain SB, Schiebler ML, Nagle SK, Liu F. Improved Segmentation of Proton MRI Lung Volume Using a 2.5D Deep Convolutional Neural Network. ISMRM Work Mach Learn Part I, Pacific Grove, CA, 2018.
[6] Zaharchuk G, Busse RF, Rosenthal G, Manley GT, Glenn OA, Dillon WP. Noninvasive oxygen partial pressure measurement of human body fluids in vivo using magnetic resonance imaging. Acad Radiol 2006;13:1016–24. doi:10.1016/j.acra.2006.04.016.
[7] Zhang W-J, Niven RM, Young SS, Liu Y-Z, Parker GJM, Naish JH. Dynamic oxygen-enhanced magnetic resonance imaging of the lung in asthma -- initial experience. Eur J Radiol 2015;84:318–26. doi:10.1016/j.ejrad.2014.10.021. [8] Zha W, Kruger SJ, Johnson KM, Cadman R V, Bell LC, Liu F, et al. Pulmonary Ventilation Imaging in Asthma and Cystic Fibrosis Using Oxygen-Enhanced 3D Radial Ultrashort Echo Time MRI. J Magn Reson Imaging 2018;47:1287–97. doi:10.1002/jmri.25877.
[9] Naish JH, Parker GJM, Beatty PC, Jackson A, Young SS, Waterton JC, et al. Improved Quantitative Dynamic Regional Oxygen-enhanced Pulmonary Imaging Using Image Registration. Magn Reson Med 2005;54:464–9. doi:10.1002/mrm.20570.
[10] Martini K, Gygax CM, Benden C, Morgan AR, Parker GJM, Frauenfelder T. Volumetric Dynamic Oxygen-enhanced MRI (OE-MRI): Comparison with CT Brody Score and Lung Function in Cystic Fibrosis Patients. Eur Radiol 2018:1–11. doi:10.1007/s00330-018-5383-5.
[11] Marshall H, Deppe MH, Parra-Robles J, Hillis S, Billings CG, Rajaram S, et al. Direct visualisation of collateral ventilation in COPD with hyperpolarised gas MRI. Thorax 2012;67:613–7. doi:10.1136/thoraxjnl-2011-200864.
[12] Liu F, Feng L, Kijowski R. MANTIS: Model-Augmented Neural neTwork with Incoherent k-space Sampling for Efficient Estimation of MR Parameters. ISMRM Work OnMachine Learn Part II, Cap Hilton, Washington, DC, USA 2018.
[13] Mardani M, Gong E, Cheng JY, Vasanawala S, Zaharchuk G, Alley M, et al. Deep Generative Adversarial Networks for Compressed Sensing Automates MRI. IEEE Trans Med Imaging 2017;PP:1. doi:10.1109/TMI.2018.2858752.
Figures