0014
Investigating the relationship between free-breathing 1H and breath-hold 3He MRI in patients with cystic fibrosis1POLARIS, Academic Radiology, University of Sheffield, Sheffield, United Kingdom, 2Institute for Diagnostic and Interventional Radiology, Hannover Medical School, Hannover, Germany, 3Sheffield Children's Hospital, Sheffield, United Kingdom
Synopsis
Free-breathing non-contrast enhanced 1H MRI techniques show promise as a surrogate for ventilation imaging but more validation against methods which directly image lung ventilation is needed in patients. The aim of this work was to investigate the relationship between 1H free-breathing and 3He breath-hold ventilation images in patients with CF. Phase-resolved functional lung (PREFUL) 1H and 3He ventilation images were compared in 10 patients with CF. Qualitative similarities were observed between techniques to varying degrees. Ventilation defect percentage showed strong correlation between methods and with FEV1, although median and inter-quartile range fractional ventilation values were not related.
Introduction
Free-breathing non-contrast enhanced 1H MRI techniques based on Fourier decomposition show promise as a surrogate for ventilation imaging1,2. However, there has been little validation performed against methods which directly image lung ventilation in patients.
Ventilation defect percentage (VDP) calculated from free-breathing 1H ventilation imaging has shown moderate correlation with 3He VDP in patients with COPD3 and patients with asthma4. Fractional ventilation (FV) measured using free-breathing 1H ventilation imaging has shown strong regional correlation with 19F dynamic washout MRI in patients with COPD5.
The aim of this work was to investigate the relationship between 1H free-breathing and 3He breath-hold ventilation images in patients with cystic fibrosis (CF).
Methods
Ten patients with CF were scanned using a 1.5T whole body MRI system (GE HDx). Patients also underwent spirometry.
3He MRI: A mix (500-1000mL) of hyperpolarized 3He (25% polarization, 120-150mL) and N2 was inhaled from functional residual capacity (FRC). Sequence parameters were: 3D coronal steady state free precession (SSFP), full lung coverage, voxel size=3.3x3.3x5-4x4x5mm, θ=10°, TE/TR=0.6/1.9ms, BW=167kHz. Coil: 3He transmit-receive vest coil (CMRS). 1H anatomical images of the same imaging volume were acquired during the same 14s breath-hold.
Free-breathing 1H MRI: 2D spoiled gradient echo (SPGR) dynamic images of a single coronal slice were acquired during 75 seconds of free-breathing. The slice was positioned where ventilation abnormality was evident on the 3He images. Sequence parameters were: voxel size=5x5x15mm, θ=5°, TE/TR=0.7/2.3ms, BW=167kHz, temporal resolution=301ms. Coil: 8-element chest coil (GE). Phase-resolved functional lung (PREFUL) analysis6 was performed, including registration, low-pass filtering and calculation of fractional ventilation.
Analysis: Three adjacent 3He image slices matching the thicker PREFUL image slice were combined by square-root sum of squares. 3He and PREFUL images were segmented using spatial fuzzy c-means thresholding7 with 5 clusters to calculate ventilation defect percentage, and 4 clusters defined ventilation. PREFUL fractional ventilation was calculated as FVinsp=(Sexp-Sinsp)/Sexp for inspiration and values outside the lungs were excluded using the 1H image segmentation. 3He FV was calculated as FVi,j,k=VISi,j,k/Vvoxel∑Si,j,k, where VI=inhaled volume and Vvoxel=voxel volume8, and the mean FV of the 3He matching image slices was used for comparison. Median and inter-quartile range (IQR) of FV were calculated. To test for similarity between FV distributions, the 2-sample Kolmogorov-Smirnov test was performed once median histogram values were matched to normalize for translation along the FV axis. Data were tested for normality and the appropriate correlation analyses were performed between measures. Bland-Altman analysis was used to assess agreement between 3He and PREFUL metrics.
Results and Discussion
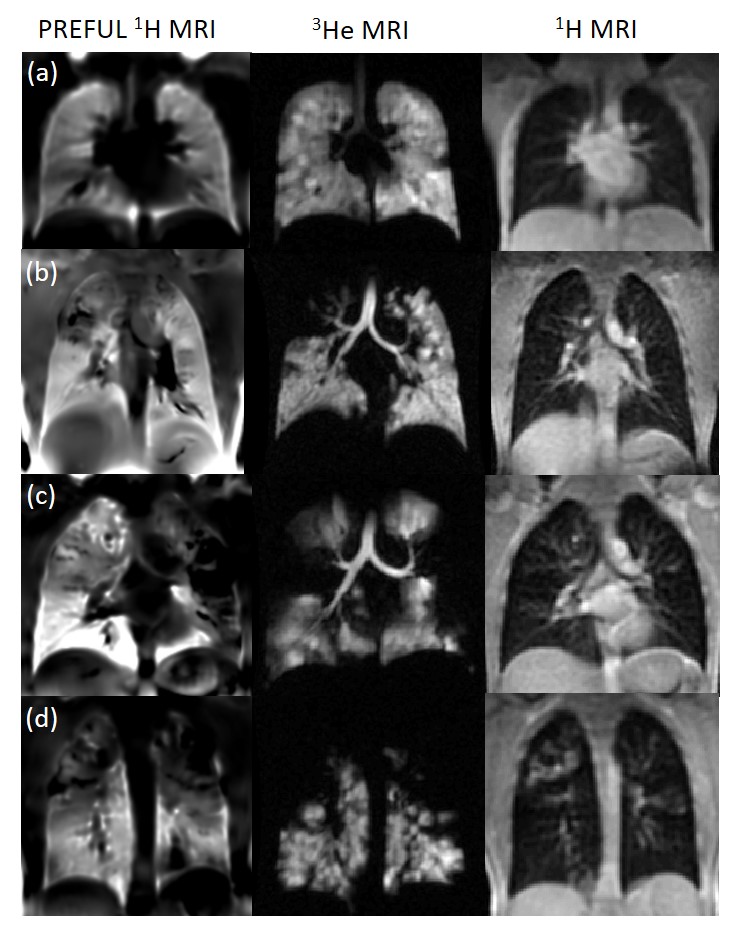
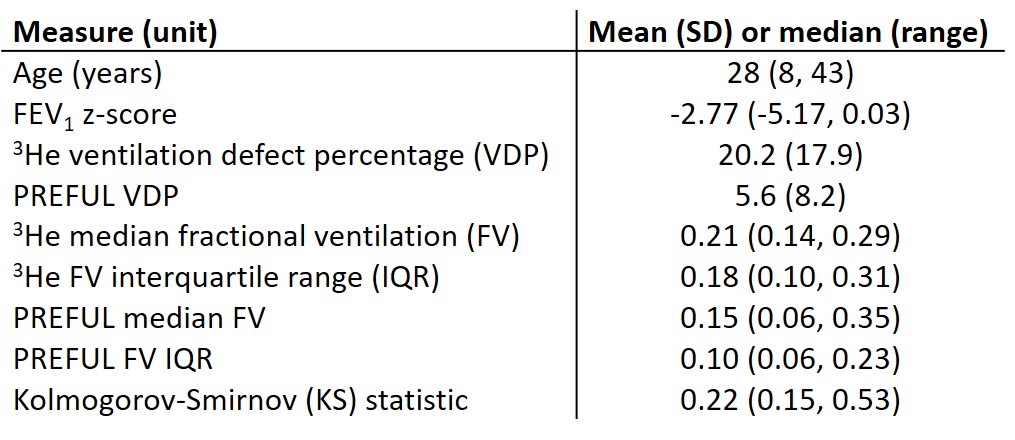
Visual similarities were observed to varying degrees between methods (figure 1). Table 1 summarizes patient demographics and quantitative metrics.
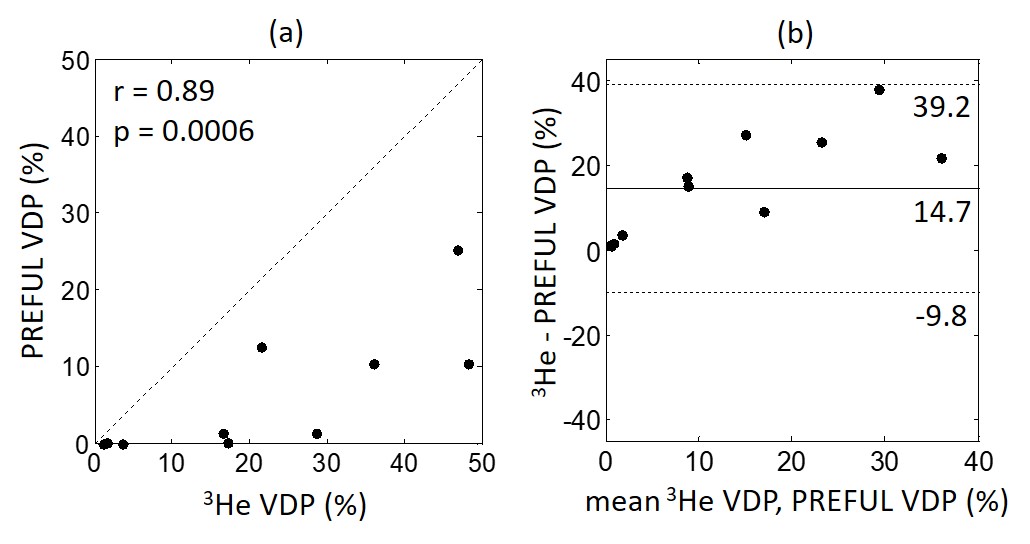
PREFUL VDP correlated strongly with 3He VDP (r=0.89, p=0.0006, figure 2a). PREFUL VDP was lower than 3He VDP with a bias of 14.7% (figure 2b), suggesting that PREFUL VDP may be less sensitive to lung abnormalities than 3He VDP. Differences between PREFUL and 3He VDP were greater with increasing mean VDP (figure 2b).
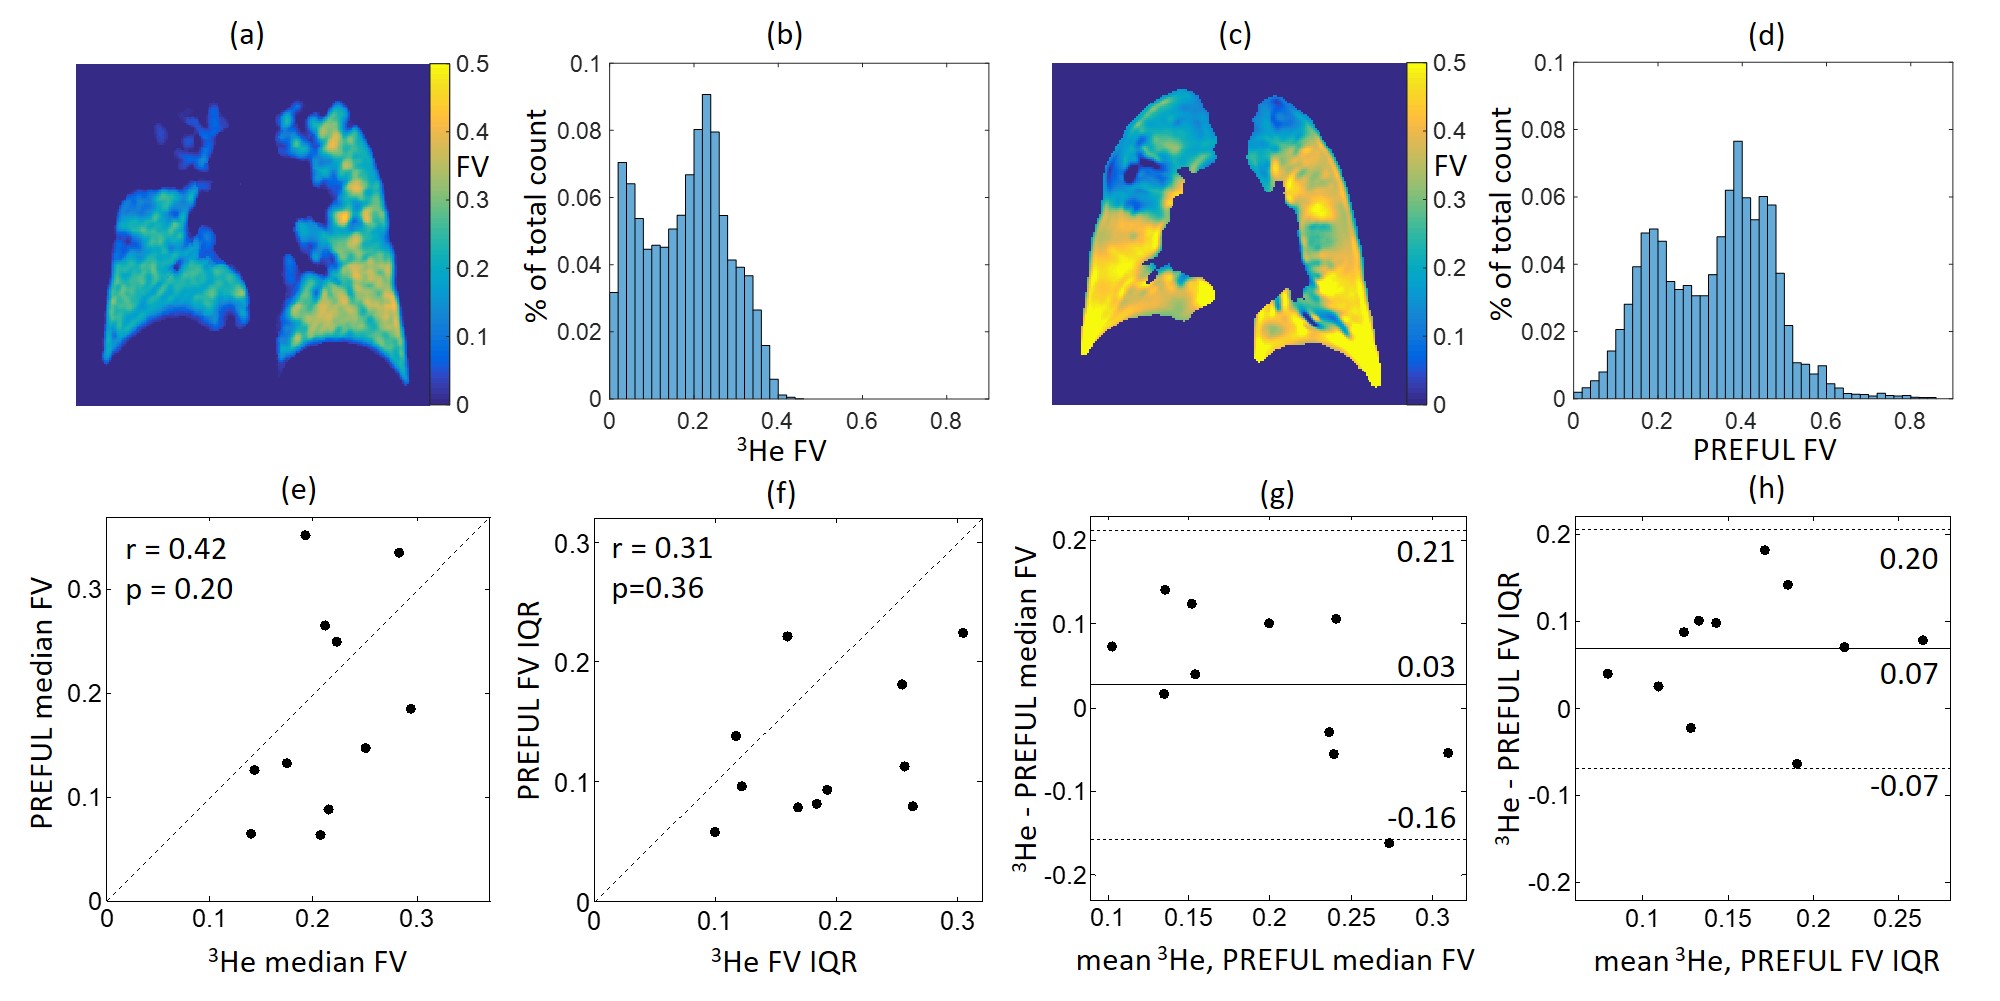
Fractional ventilation maps and histograms provide quantitative values with no requirement for thresholding. There was no significant correlation between PREFUL and 3He median or IQR FV (figure 3e,f), although in some cases FV maps and histograms showed similar features (figure3a-d). FV median and IQR were smaller for PREFUL than 3He (figure 3g,h), consistent with the definition of FV as the ratio of fresh gas entering a volume unit to the end inspiratory size of the unit, and the differing lung volumes during image acquisition (FRC plus 500-1000mL for 3He and FRC plus 193-665mL estimated for PREFUL using a typical tidal volume of 7mL/kg bodyweight9).
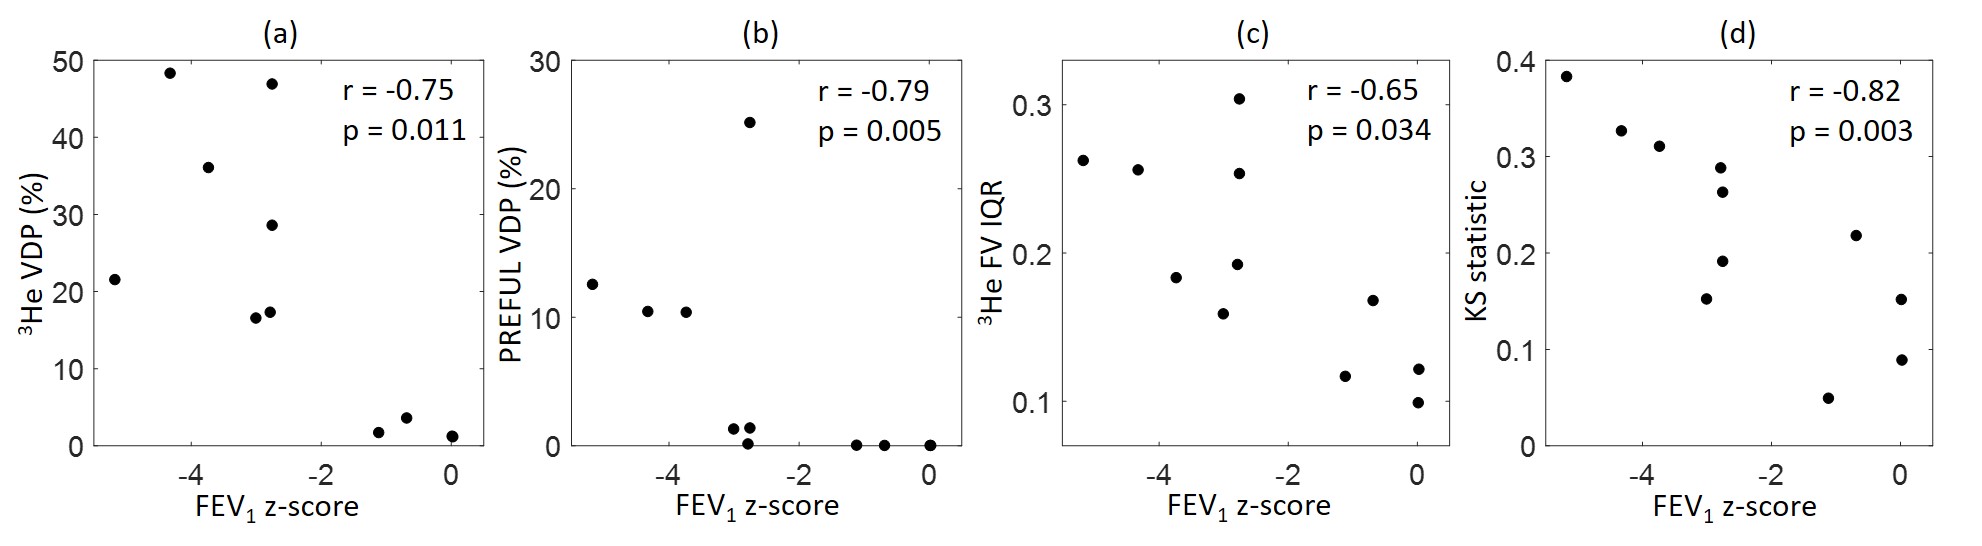
PREFUL VDP, 3He VDP and 3He FV IQR correlated with FEV1 z-score (figure 4). Strong correlations of the Kolmogorov-Smirnov statistic with FEV1 z-score (figure 4d) and VDP suggest that 3He and PREFUL FV histograms become more dissimilar as disease severity increases. Differences between techniques may be due to the fundamentally different sources of image contrast, mechanisms of 1H signal modulation due to respiratory motion and 3He inhaled gas density respectively. Study limitations are some error in matching planes between 1H and 3He MRI, and differences in voxel size.
Conclusion
Qualitative similarities were observed between 1H PREFUL and 3He ventilation images in the lungs of patients with CF to varying degrees. PREFUL VDP was lower than 3He VDP with bias of 14.7%. VDP showed strong correlation between techniques and with the clinical metric of FEV1 z-score, although PREFUL and 3He median and IQR FV were not related. From these data we cannot conclude that the two techniques are measuring the same mechanism that is related to lung ventilation and further work is needed.Acknowledgements
This work was funded by the Medical Research Council (MR/M008894/1) and the National Institute of Health Research (NIHR-RP-R3-12-027). The views expressed in this publication are those of the authors and not necessarily those of the National Health Service, the National Institute for Health Research or the Department of Health. Thanks to patients from Sheffield Children's Hospital, Sheffield Teaching Hospitals and University Hospital of South Manchester.
References
[1] Voskrebensev A, Greer M, Gutberlet M, Schonfeld C, Renne J, Hinrichs J, Kaireit T, Welte T, Wacher F, Gottlieb J, Vogel-Claussen J. Detection of lung allograft dysfunction using ventilation-weighted Fourier decomposition MRI. Am J Transplant 2018 18(8):2050-2060.
[2] Nyilas S, Bauman G, Pusterla O, Ramsey K, Singer F, Stranzinger E, Yammine S, Casaulta C, Bieri O, Latzin P. Ventilation and perfusion assessed by functional MRI in children with CF: reproducibility in comparison to lung function. J Cyst Fibros 2018, doi: 10.1016/j.jcf.2018.10.003.
[3] Capaldi DP, Sheikh K, Guo F, Svenningsen S, Etemad-Rezai R, Coxson HO, Leipsic JA, McCormack DG, Parraga G. Free-breathing pulmonary 1H and hyperpolarized 3He MRI: comparison in COPD and bronchiectasis. Acad Radiol 2015 22(3):320-9.
[4] Capaldi DPI, Sheikh K, Eddy RL, Guo F, Svenningsen S, Nair P, McCormack DG, Parraga G. Free-breathing functional pulmonary MRI: response to bronchodilator and bronchoprovocation in severe asthma. Acad Radiol 2017 24(10):1268-76.
[5] Kaireit TF, Gutberlet M, Voskrebenzev A, Freise J, Welte T, Hohlfeld JM, Wacker F, Vogel-Claussen J. Comparison of quantitative regional ventilation-weighted fourier decomposition MRI with dynamic fluorinated gas washout MRI and lung function testing in COPD patients. J Magn Reson Imaging 2018 47(6):1534-41.
[6] Voskrebenzev A, Gutberlet M, Klimes F, Kaireit TF, Schonfeld C, Rotarmel A, Wacher F, Vogel-Claussen J. Feasiblity of quantitative regional ventilation and perfusion mapping with phase-resolved functional lung (PREFUL) MRI in healthy volunteers and COPD, CTEH, and CF patients. Magn Reson Med 2018 79(4):2306-14.
[7] Hughes PJC, Horn FC, Collier GJ, Biancardi A, Marshall H, Wild JM. Spatial fuzzy c-means thresholding for semiautomated calculation of percentage lung ventilated volume from hyperpolarized gas and 1H MRI. J Magn Reson Imaging 2018 47(3):640-6
[8] Tzeng YS, Lutchen K, Albert M. The difference in ventilation heterogeneity between asthmatic and healthy subjects quantified using hyperpolarized 3He MRI. J Appl Physiol 2009 106(3):813-22.
[9] Beardsell I et al: MCEM Part A: MCQs page 33, Royal Society of Medicine Press, 2009
Figures