0012
3D UTE Yarn Ball Acquisition MRI for Quantification of Lung Water Content1Biomedical Engineering, University of Alberta, Edmonton, AB, Canada
Synopsis
The goal of this study was to develop and validate a fast, robust and quantitative MRI method for the evaluation of lung water density, for the detection of pulmonary edema. Short lung T2* necessitates ultrashort TE (UTE) acquisitions. We propose a novel optimized UTE Yarn-Ball k-space trajectory that uses ~15% of the pure radial readouts arms required to achieve full sampling. Phantom studies validated accurate water density quantification. A dual-echo approach enabled automated lung tissue segmentation. An optimized Yarn-Ball k-space trajectory yields three-dimensional spin-density weighted lung water images (2.5mm isotropic resolution), without the need for breath-holding, in ~2 minutes.
Introduction
Pulmonary edema (PE) is the accumulation of extravascular fluid in the lungs, leading to hypoxia and symptoms of respiratory distress. Cardiogenic PE is the consequence of left-sided heart failure and/or fluid overload while non-cardiogenic PE follows injury to the alveolar-capillary barriers.1 Current measurement approaches are either insensitive (X-Ray), qualitative (ultrasound) or have some risk (ionizing radiation/invasive). With MRI, center-out radial k-space acquisitions enable the required ultra-short echo times (UTE) and short readout lengths that are necessary for imaging of the short T2* lung parenchyma (<1 ms at 3T).2 However, pure radial trajectories are inefficient, requiring long scan times and/or undersampling3 (e.g. >45,000 arms for Nyquist sampling in a 300 mm FOV and 2.5 mm isotropic resolution). The goal of this study was to develop and validate a fast, robust and quantitative MRI method for evaluation of lung water content that is appropriate for application in patients with pulmonary congestion (short scan time and no requirement for breath-holding).Methods
We propose a novel optimized Yarn-Ball k-space trajectory
that requires as few 15% of the radial readouts arms to achieve full sampling
(Fig 1).4 The Yarn-Ball
trajectories used in the current study consisted of 7381 arms with dual-echo readouts
of TE = 0.07ms and 2.79 ms, where the 2nd echo image yielded dark
lung images for automated lung segmentation.
A low flip angle of 2°
with TR = 3.54 ms ensured minimal T1 weighting. All images were
acquired with body-coil excitation and signal reception from a 34 element
chest/back array (3T Siemens PRISMA, Erlangen, Germany). Breath-hold (26 seconds) and free-breathing (131
seconds) sequence variations were compared in 10 healthy subjects. The free-breathing variant used repeated
k-space acquisitions to enable retrospective data selection at end-expiration
to remove breathing motion effects, using the center of k-space to generate a
respiratory signal. Background signal
variations from radiofrequency (B1) transmit and receive inhomogeneities were
measured using only solid tissues (e.g. liver, skeletal and cardiac muscle) to
which a smooth surface was fit in each coronal slice using Tikhonov regularization. A finite difference operator was used
and the regularization parameter was selected with the L-curve method5. The smoothed correction surface was used to
normalize all pixels, included those in the lung, yielding lung signal units of
relative water fraction to the solid reference tissues. Phantom experiments (sponge with variable
water density of 9% to 55%) were used to validate absolute water
quantification. Results
Phantom experiments showed excellent agreement between
sponge wet weight and imaging-derived water density (y = 1.0075x +0.7716, x = 9.28
to 55.44%, p<0.001, R2 = 0.9934). Figure 2 shows typical in-vivo lung water images in 3 orientations,
before and after background signal correction, for both breath-hold and
free-breathing acquisitions. Figure 3
compares images at both echo times and the corresponding automatically
segmented lung tissue mask (free-breathing). Figure 4 summarizes the chest to
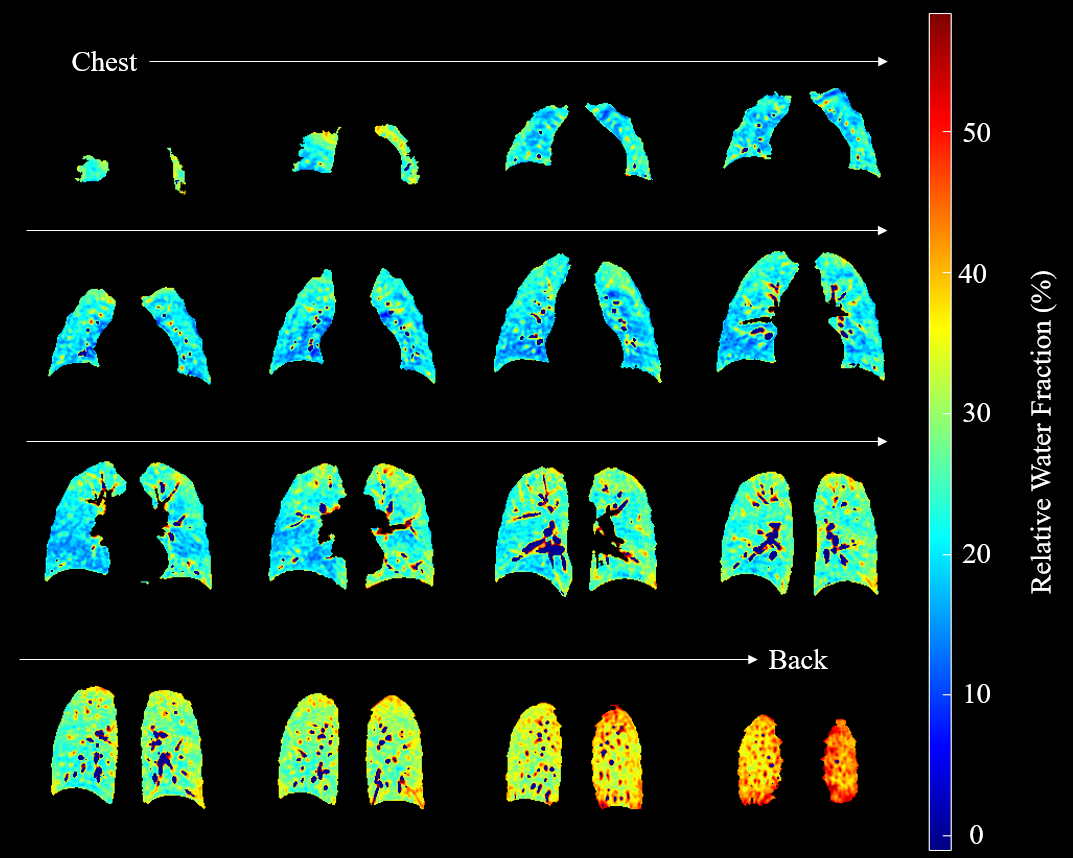
back lung water signal variation from all subjects (free-breathing). The mean
relative water fraction was 30% (IQR = 27% - 33%) in our 10 healthy subjects. Figure
5 shows a typical lung water distribution from chest to back (free-breathing).Discussion
Effective lung water quantification requires sufficient spatial resolution to resolve and remove blood vessels, minimization of T2* and T1 weighting, full lung spatial coverage, and correction for radiofrequency field inhomogeneities all in a patient friendly acquisition in subjects who will have difficulty remaining supine or holding their breath due to pulmonary congestion. The presented Yarn-Ball approach was shown to satisfy all of these requirements, and thus offers a practical and quantitative lung water density imaging approach.Conclusion
An optimized Yarn-Ball k-space trajectory yields three-dimensional spin-density weighted lung water images (2.5 mm isotropic resolution) without the need for breath-holding in ~2 minutes.Acknowledgements
Funding for this project was provided by the Canadian Institute of Health Research.References
1. Murray JF. Pulmonary edema: pathophysiology and diagnosis. Int J Tuberc Lung Dis. 2011; 15(2):155-60.
2. Yu J, Xue Y, Song HK. Comparison of lung T2* during free-breathing at 1.5 T and 3.0 T with ultrashort echo time imaging. Magn Reson Med. 2011; 66(1):248-54.
3. Gibiino F, et al. Free-breathing, zero-TE MR lung imaging. MAGMA. 2015; 28(3):207-15.
4. Stobbe RW, Beaulieu C. Rapid 3D Spoiled Steady-State Imaging with Yarn-Ball Acquisition [abstract]. In: ISMRM 23rd Annual Meeting; 2015 May 30 - June 5; Toronto: Abstract nr 2442.
5. Hansen PC, O'Leary DP. The use of the L-curve in the regularization of discrete ill-posed problems. SIAM J Sci Comput. 1993; 14(6), 1487-1503.
Figures