0011
Evaluation of automatic methods for arterial input function extraction for perfusion quantification in the lung.1Bioxydyn Limited, Manchester, United Kingdom, 2Division of Cardiovascular Sciences, University of Manchester, Manchester, United Kingdom, 3POLARIS, Academic Radiology, University of Sheffield, Sheffield, United Kingdom, 4The University of Manchester, Manchester, United Kingdom, 5Royal United Hospitals Bath NHS Foundation Trust, Bath, United Kingdom, 6The University of Manchester NHS Foundation Trust, Manchester, United Kingdom, 7Central Manchester University Hospitals NHS Foundation Trust, Manchester, United Kingdom, 8Sheffield Teaching Hospitals NHS Foundation Trust, Sheffield, United Kingdom, 9Quantitative biomedical Imaging Lab, Faculty of Biology, Medicine, and Health, University of Manchester, Manchester, United Kingdom
Synopsis
We developed automatic methods to extract the AIF for lung first pass perfusion DCE and compared their performance with manual selection of an ROI in the pulmonary artery (PA). Dynamic enhancement was calculated by simple subtraction and with a shuffle subtraction. Early enhancing voxels with the highest enhancing values were selected. We demonstrated that the shuffle subtraction is a more robust method, since it avoids including the early enhancing subclavian vein. Our results suggest obtaining the AIF automatically from pixels within the RV may be more robust against partial volume effects and removes inter-reader variability.
Introduction
The arterial input function (AIF) plays an important role in the quantification of perfusion parameters using first-pass contrast-enhanced methods. Ideally, the AIF should be measured at the inlet of the tissue, but practically it is commonly derived by manual selection of a region of interest (ROI) inside a vessel upstream. The disadvantage of the manual ROI selection is the difficulty of avoiding partial volume effect and the variability between observers [1]. In this work, we developed automatic methods to extract the AIF for lung first pass perfusion measurements and compared their performance with manual selection of an ROI in the pulmonary artery (PA).Methods
10 patients with interstitial lung disease of mixed origin underwent thoracic perfusion MRI at 1.5 T (Signa HDxt GE). The protocol comprised four coronal fast 3D SPGR variable flip angle datasets to calculate baseline T1 (TE/TR= 0.9/2.85 ms, BW= 62.5 kHz, FOV= 48 cm, acquisition matrix 200x80x60, FA= 2,4,10,30 deg). These were followed by a view-sharing acquisition (TE/TR= 0.7/2 ms, FA= 20⁰, BW= 125 kHz, FOV= 48 cm, matrix= 200x80x24, temporal phases= 48, acquisition time per frame 0.56 s, ASSET/SENSE factor= 2, turbo mode= 2). At the start of this acquisition, a bolus injection of 0.06 mL/kg gadoteric acid (Dotarem, Guerbet, Villepinte, France) was administered in the left antecubital vein by a power injector at 2 mL/s followed by a saline flush at 4 mL/s. All images were acquired at end expiration breath hold.
Dynamic enhancement was calculated with respect to baseline (mean of frames 2 - 5) by simple subtraction and with a shuffle subtraction with radius 3. Shuffle subtraction has been used in hand DCE-MRI [3] to obtain precontrast to postcontrast difference maps less sensitive to small errors in movement/registration. Voxels presenting a peak after time-point 20 (11 s) were eliminated, and the 50 strongest-enhancing voxels were averaged for AIF extraction. Two independent readers were instructed to select a ROI over 1-2 slices in the main trunk of the PA using ITK-SNAP (4; http://www.itksnap.org). The concentration of Contrast Agent (CA) was calculated using the ROI T1 values extracted from the calculated T1 map. Each AIF was corrected by the subject haematocrit. The parameters considered for each AIF were: time to peak, peak amplitude, full width at half maximum (FWHM) and the area under the curve (AUC) over the entire time series, normalised by the dose of CA administered. Bland-Altman plots were created to analyse inter-rater agreements between the two manual readers.
Results
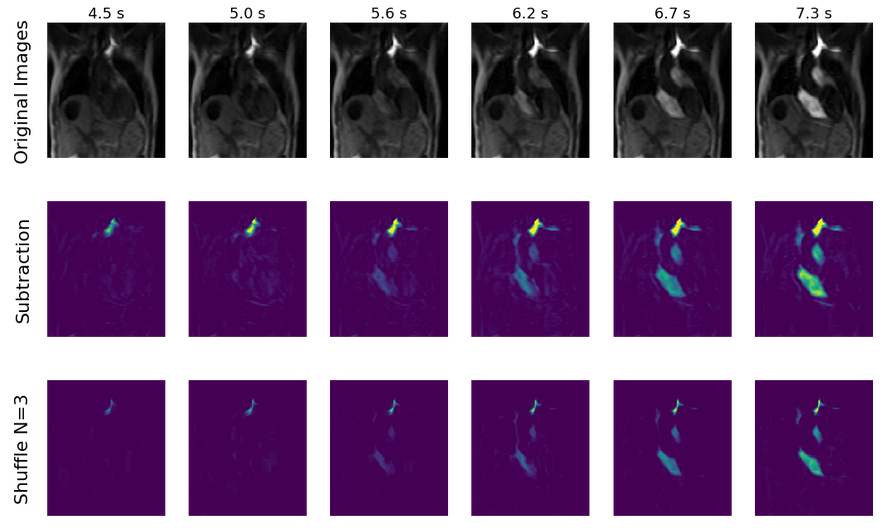
Figure 1 presents an example of the effect of using different subtraction methods for defining the degree of dynamic enhancement.
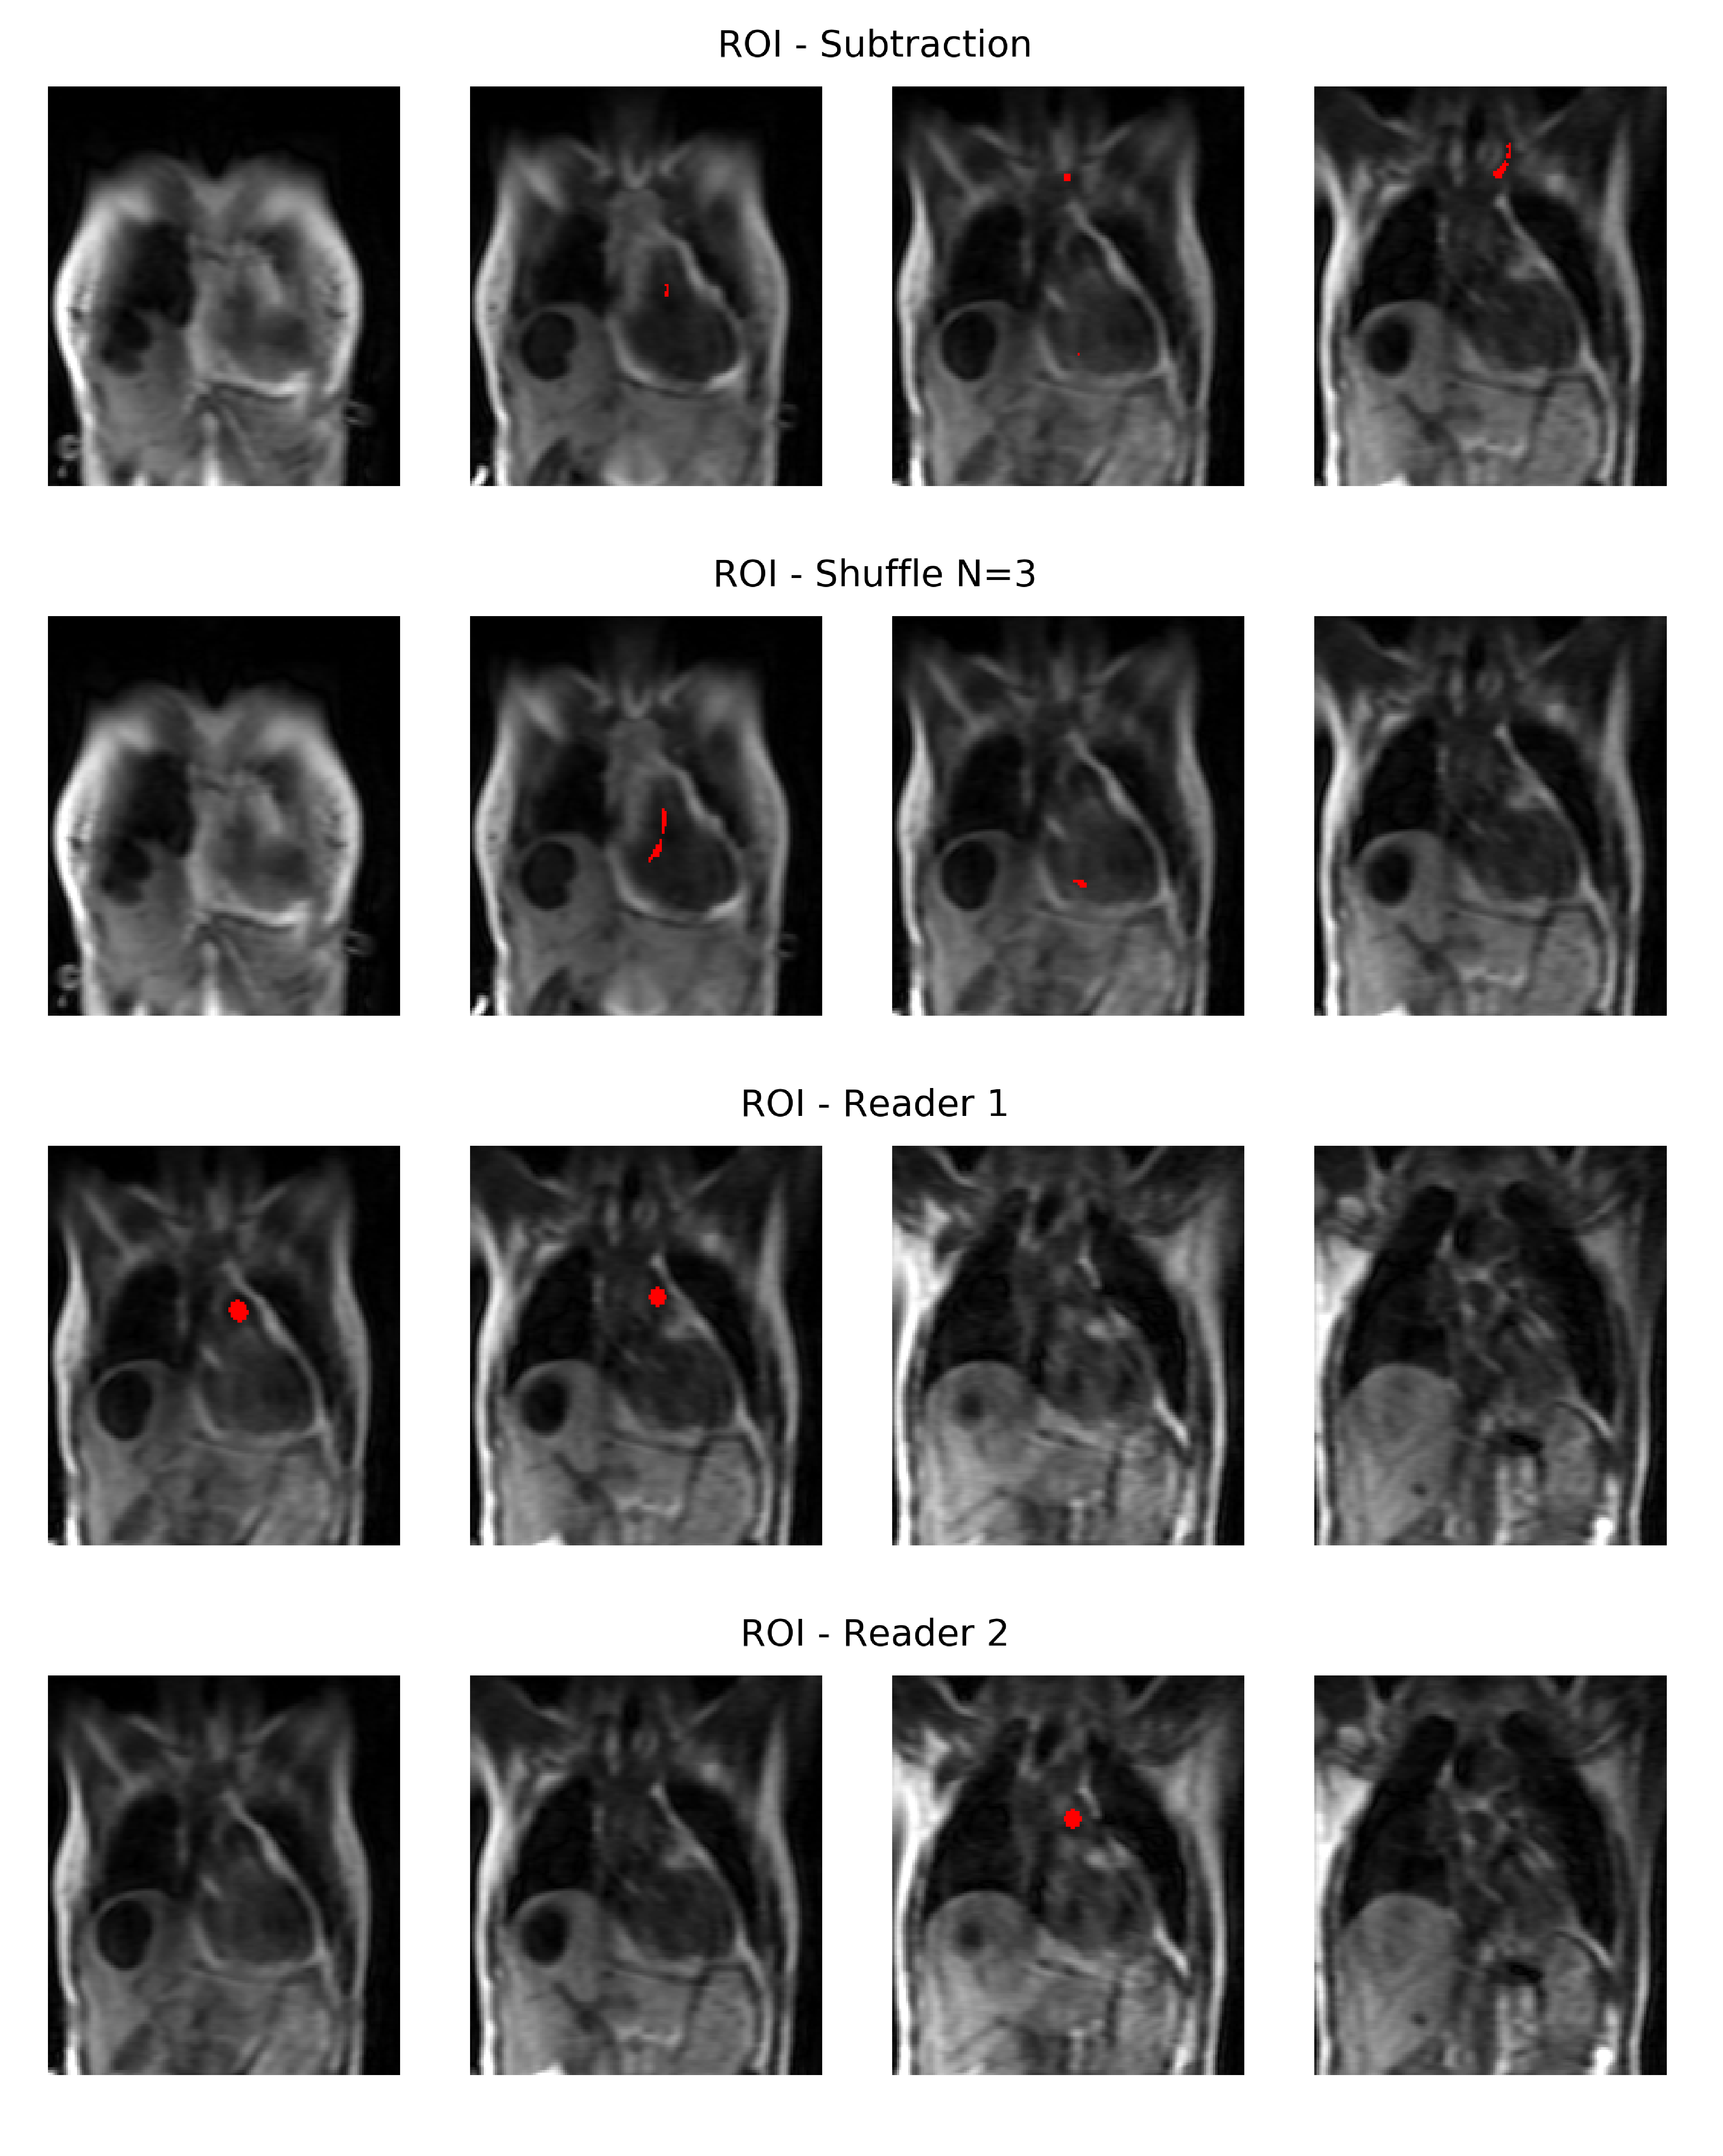
Figure 2 presents an example of manual and automatic ROIs placement. The shuffle subtraction identifies voxels within the right ventricle (RV) and atrium, with the simple subtraction method also identifying voxels in the subclavian vein.
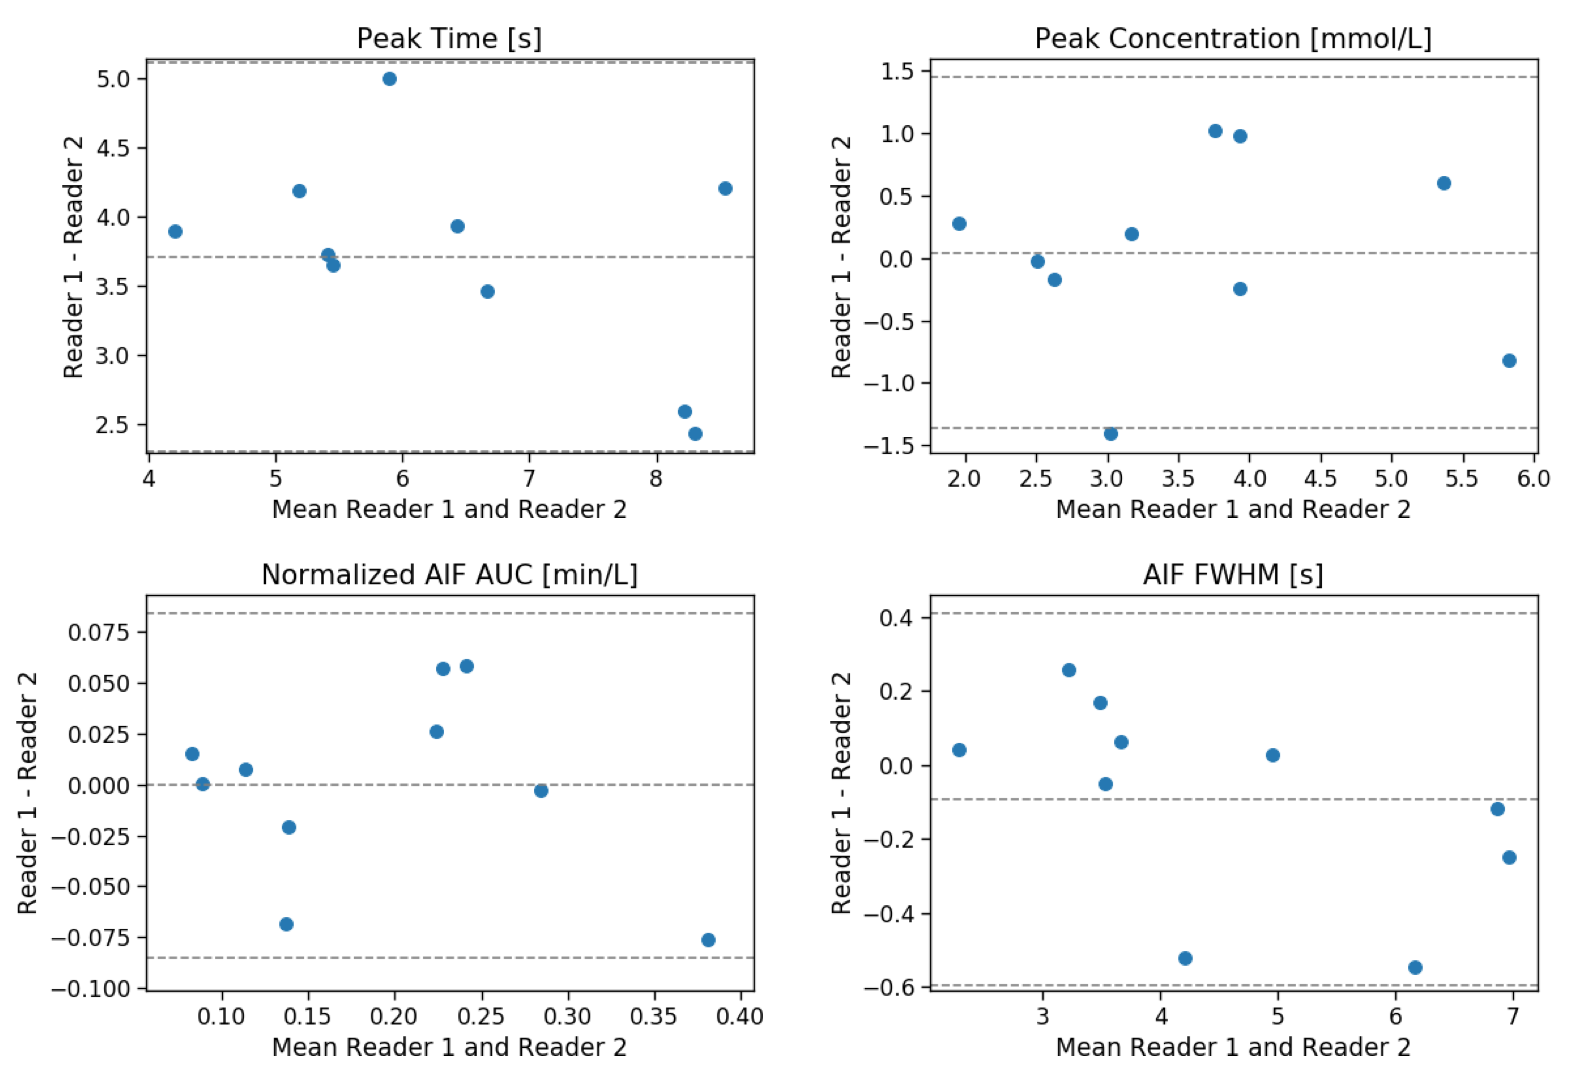
Figure 3 presents the Bland-Altman plots comparing the results of manual readers.
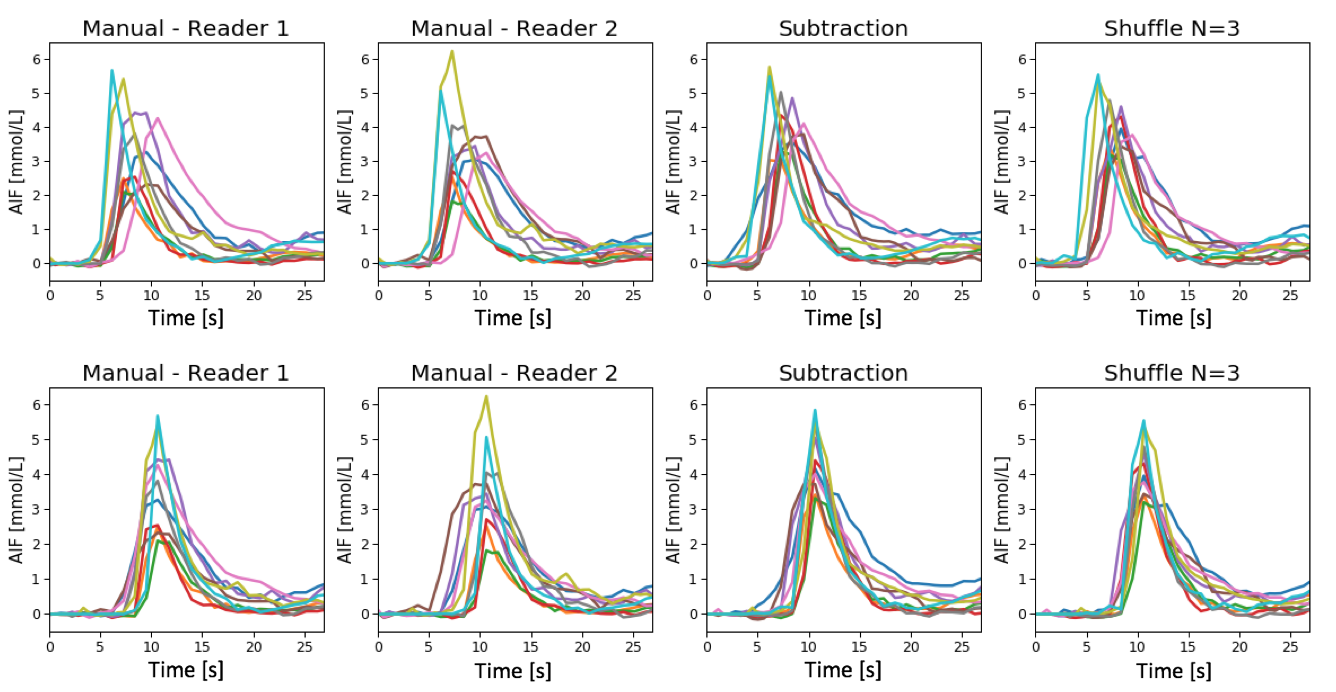
Figure 4 represents all the calculated AIFs, as they were extracted and aligned by the highest peak. Visual inspection shows highest variability in AIF amplitude and shape in the manually-defined case; least variability is observed when using the shuffle transform.
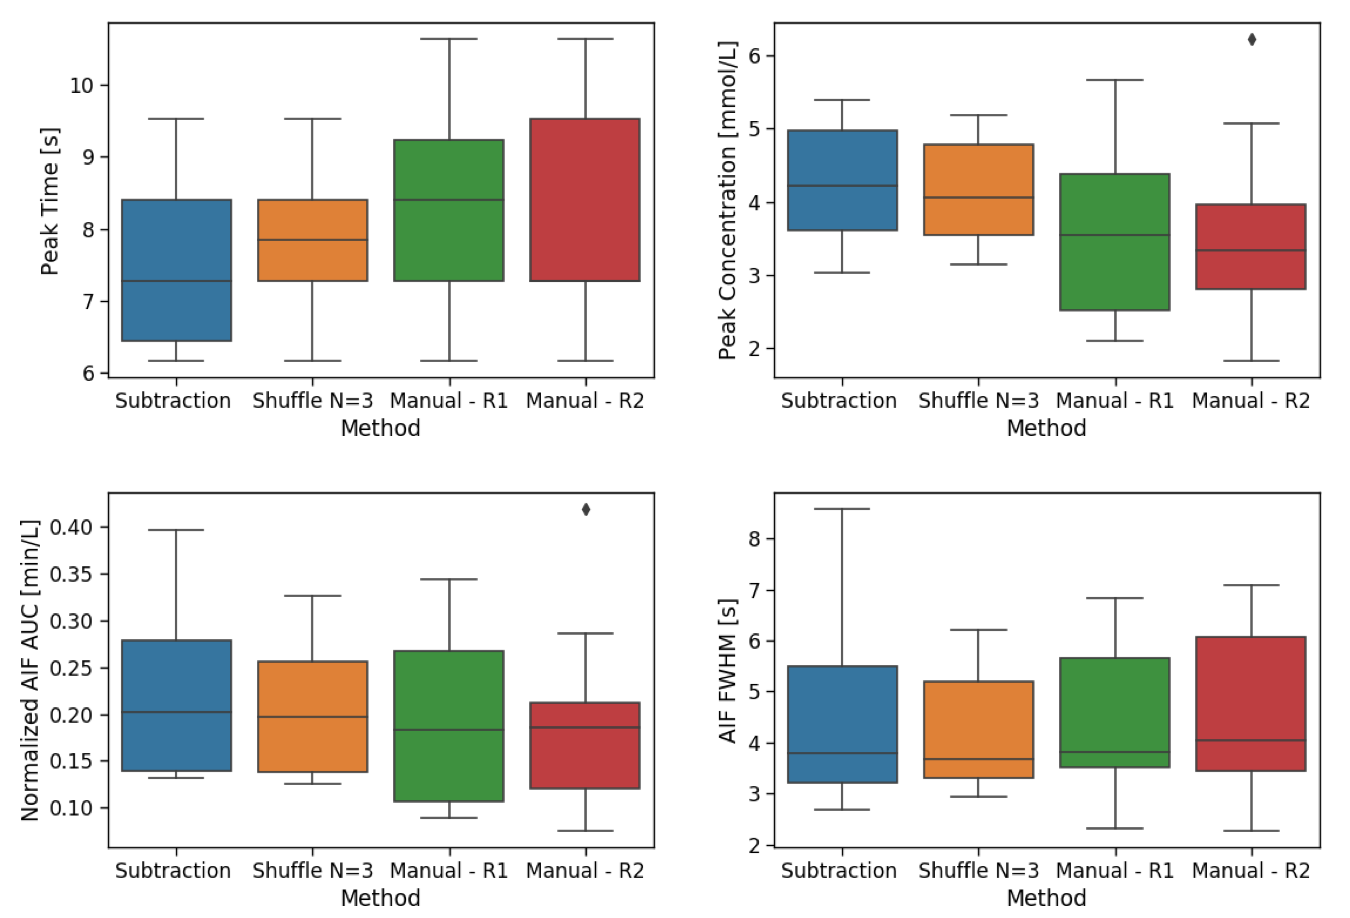
Figure 5 reports the box-plot for all the parameters calculated from the AIFs. The automatic AIF definition methods identify generally earlier-enhancing voxels, consistent with selecting voxels proximal to the PA. Peak concentration is generally lowest when using manual AIF definition, likely due to partial volume effects and is least variable when using the shuffle subtraction method. Median AUC and FWHM values are comparable; however, the shuffle subtraction method again shows the least variability between patients.
Discussion
Identifying a ROI in the PA may be considered the gold standard method for extracting the AIF in lung DCE. However our results suggest obtaining the AIF automatically from pixels within the RV may be more robust against partial volume effects and removes inter-reader variability.
The inclusion of pixels within the subclavian vein results in the broadening of the resulting AIF peak. The
shuffle subtraction avoids this by favouring larger areas of enhancement and therefore is preferable to the simple subtraction. The variability observed when
using manual AIF definition is substantially greater than either automated
method.
The Bland-Altman plots shows
that no bias is present between the two manual readers, except for time to peak. Large variability is obtained, particularly
in the peak concentration.
Conclusions
We have developed a completely automatic method to identify the AIF in first-pass lung perfusion measurements. The shuffle subtraction is a more robust method to define the dynamic enhancement than a simple subtraction. In a population of patients with lung diseases, the shuffle subtraction method results in highly consistent results between individuals, unlike manual ROI selection.Acknowledgements
The research leading to these results received funding from the Innovative Medicines Initiatives 2 Joint Undertaking under grant agreement No 116106. This Joint Undertaking receives support from the European Union’s Horizon 2020 research and innovation programme and EFPIA.References
1. Miller, C. A., Naish, J. H., Ainslie, M. P., Tonge, C., Tout, D., Arumugam, P., ... & Steadman, C. D. (2014). Voxel-wise quantification of myocardial blood flow with cardiovascular magnetic resonance: effect of variations in methodology and validation with positron emission tomography. Journal of Cardiovascular Magnetic Resonance. 2014:16(1), 11.
2. Parker, G. J., A. Jackson, J. C. Waterton, and D. L. Buckley. "Automated arterial input function extraction for T1-weighted DCE-MRI." In Proceedings of the 11th Annual Meeting of ISMRM, Toronto, Canada, vol. 11, p. 1264. 2003.
3. Xanthopoulos, E., Hutchinson, C. E., Adams, J. E., Bruce, I. N., Nash, A. F., Holmes, A. P., ... & Waterton, J. C. Improved wrist pannus volume measurement from contrast-enhanced MRI in rheumatoid arthritis using shuffle transform. Magnetic resonance imaging. 2007; 25(1), 110-116
4. P.A. Yushkevich, J. Piven, H.C. Hazlett, R.G. Smith, S. Ho, J.C. Gee, G. Gerig User-guided 3D active contour segmentation of anatomical structures: significantly improved efficiency and reliability. NeuroImage. 2006; 31, pp. 1116-1128
Figures