0009
The Accuracy of Hyperpolarized 129Xe Ventilation Derived from 3D Radial Gas Exchange MRI versus Multi-Slice Gradient Echo ImagingMu He1,2, Ziyi Wang2,3, Leith Rankine2,4, Elianna A Bier2,3, John Nouls2, and Bastiaan Driehuys2,4
1Department of Electrical Engineering and Computer, Duke University, DURHAM, NC, United States, 2Center for In Vivo Microscopy, Duke University Medical Center, Durham, NC, United States, 3Department of Biomedical Engineering, Duke University, DURHAM, NC, United States, 4Department of Medical Physics, Duke University, DURHAM, NC, United States
Synopsis
Both multi-slice GRE and 3D-radial acquisitions can image regional ventilation in the lungs. Here, we sought to evaluate the accuracy of the ventilation images acquired as part of a 3D-radial gas-exchange acquisition by comparing them with those acquired with a standard GRE acquisition. Linear-binning quantification was applied on both acquisitions to derive the quantitative metrics, through which we found good qualitative and modest pixel-wise agreement between the two ventilation scans. With further reconciliation of bias-field correction and threshold-setting for the 3D-radial pipeline, it could become a one-stop shop for single-breath ventilation and gas exchange imaging.
Introduction:
The majority of hyperpolarized gas ventilation MR-acquisitions employ multi-slice fast gradient recalled echo (GRE) imaging (1-3). Such sequences are fast, robust, and reconstruct in real-time to provide exquisitely detailed images of regional ventilation. However, more recently a 3D-radial acquisition has emerged to provide an all-inclusive, isotropic image of 129Xe not only in the gas-phase but also its uptake in interstitial barrier and red blood cell compartments. Here we investigate whether the ventilation images acquired as part of this gas-exchange scan can provide equally meaningful information as derived from a standard GRE acquisition.Methods:
11 subjects with chronic obstructive pulmonary disease (COPD) (age: 64±6 years, FEV1:45±19) were enrolled for imaging on a 3-Tesla SIEMENS MAGNETOM Trio scanner (VB19) (4). Subjects underwent dedicated ventilation MRI using a multi-slice GRE sequence with 4x4x(12-18) mm3 resolution accompanied by a matching 1H thoracic cavity image acquired using a steady-state fast spin-echo (SSFSE) sequence. Subsequently 3D-radial ventilation images were acquired as part of a gas exchange sequence (4), using 1000 randomized radial views and reconstructed to 1283 using a field-of-view of 403 cm3 (4, 5). This was accompanied by a matching 3D-radial 1H thoracic cavity scan reconstructed from 4701 views. All ventilation images were quantified by linear-binning (2, 6) to derive the ventilation defect percentage (VDP), as well as low-, medium- and high-ventilation percentage (LVP, MVP, HVP). Because 3D ventilation images generate a non-Gaussian ventilation distribution in healthy volunteers, a Box-Cox transform was applied to derive appropriate thresholds for quantification. The resulting quantitative metrics were compared between the two acquisitions using a Bland-Altman test. The comparison was further extended to evaluate the spatial overlap of the various bins by registering these two acquisitions to the same space. To do so with high registration accuracy, the SSFSE proton images, acquired at a native resolution of 192x192x14 were first interpolated to 1283. Subsequently, the 3D-radial proton images were registered to the interpolated SSFSE images and the resulting transformation matrix was applied to the 3D-radial ventilation images. The registered 3D-radial images were then down-sampled to the 128x128x14 matrix size of the GRE ventilation scans (Figure 1) to compare the spatial overlap of the respective binning maps by their Dice coefficients.Results:
Figure 2 shows a representative case with good qualitative agreement between the two acquisitions prior to co-registration. Over the entire cohort, the metrics derived from 3D-radial vs. GRE-ventilation agreed well: VDP = 33±15% vs 39±12%, LVP=29±5% vs 24±4%, and HVP=6±2% for both. As shown in Figure 3, Bland-Altman analysis yielded limits of agreement for radial vs GRE that, for VDP, were [-31% to 16%] with a -6% bias, for LVP were [-1% to 14%] with a +6% bias, and for HVP were [-2% to 1%] with a -0.5% bias. The resampling effect of the 3D radial images is illustrated in Figure 4, which shows that all key features are preserved. After the resampling, the quantitative metrics derived from 3D-radial ventilation were largely unchanged, with VDP=34±14%, LVP=28±7%, and HVP=7±2%. A representative case is shown in Figure 5, in which a good spatial overlap was found between the two acquisitions with a dice coefficient of 0.6 for VDP. Overall, the spatial overlap between GRE and 3D-radial was modest for VDP (Dice=0.5±0.2), and relatively poor for LVP (0.3±0.1) and HVP (0.1±0.1).Discussion:
This study shows that in a cohort of COPD patients, both ventilation sequences yield similar quantitative metrics. However, Bland-Altman analysis shows that limits of agreement for VDP are not yet sufficiently tight. The work also shows that resampled 3D-radial images preserve the quantitative metrics and permit pixel-by-pixel comparison to the GRE acquisition. However, the resulting Dice coefficients show only modest agreement for VDP and relatively poor agreement for LVP and HVP. Although some of these differences may be attributable to the images being acquired during different breath-holds, and with different xenon volumes, they also highlight several areas that must be investigated to reconcile these imaging approaches. First, it must be noted that the healthy reference distribution arising from 3D-radial imaging is inherently non-Gaussian and requires using a Box-Cox transformation to set binning thresholds. However, perhaps the most significant difference between the two is the effect of bias-field correction. Although the algorithm and parameter settings applied were identical, it is likely that the physiologic gradients, which are preserved in the 3D-radial acquisition, affect the algorithm differently than for multi-slice acquisition. It is likely that with further reconciliation of bias-field correction, the 3D-radial scan could well provide the necessary information to obviate the need for a dedicated ventilation scan in a majority of cases.Acknowledgements
NIH/NHLBI R01 HL105643, NIH/NHLBI R01HL126771, and HHSN268201700001CReferences
1. Kirby M, Pike D, Coxson HO, McCormack DG, Parraga G. Hyperpolarized He-3 Ventilation Defects Used to Predict Pulmonary Exacerbations in Mild to Moderate Chronic Obstructive Pulmonary Disease. Radiology. 2014; 273(3):887-96. 2. He M, Driehuys B, Que L, Huang Y-CT. Using Hyperpolarized 129Xe MRI to Quantify the Pulmonary Ventilation Distribution. Acad Radiol. 2016. 3. Zha W, Niles DJ, Kruger SJ, et al. Semiautomated Ventilation Defect Quantification in Exercise-induced Bronchoconstriction Using Hyperpolarized Helium-3 Magnetic Resonance Imaging: A Repeatability Study. Acad Radiol. 2016; 23(9):1104-14. 4. Wang Z, He M, Bier EA, et al. Hyperpolarized 129 Xe gas transfer MRI: the transition from 1.5T to 3T. Magn Reson Med. 2018. 5. Robertson SH, Virgincar RS, He M, Freeman MS, Kaushik SS, Driehuys B. Optimizing 3D noncartesian gridding reconstruction for hyperpolarized Xe-129 MRI: focus on preclinical applications. Concept Magn Reson A. 2015; 44(4):190-202. 6. He M, Kaushik SS, Robertson SH, et al. Extending Semiautomatic Ventilation Defect Analysis for Hyperpolarized Xe-129 Ventilation MRI. Academic Radiology. 2014; 21(12):1530-41.Figures
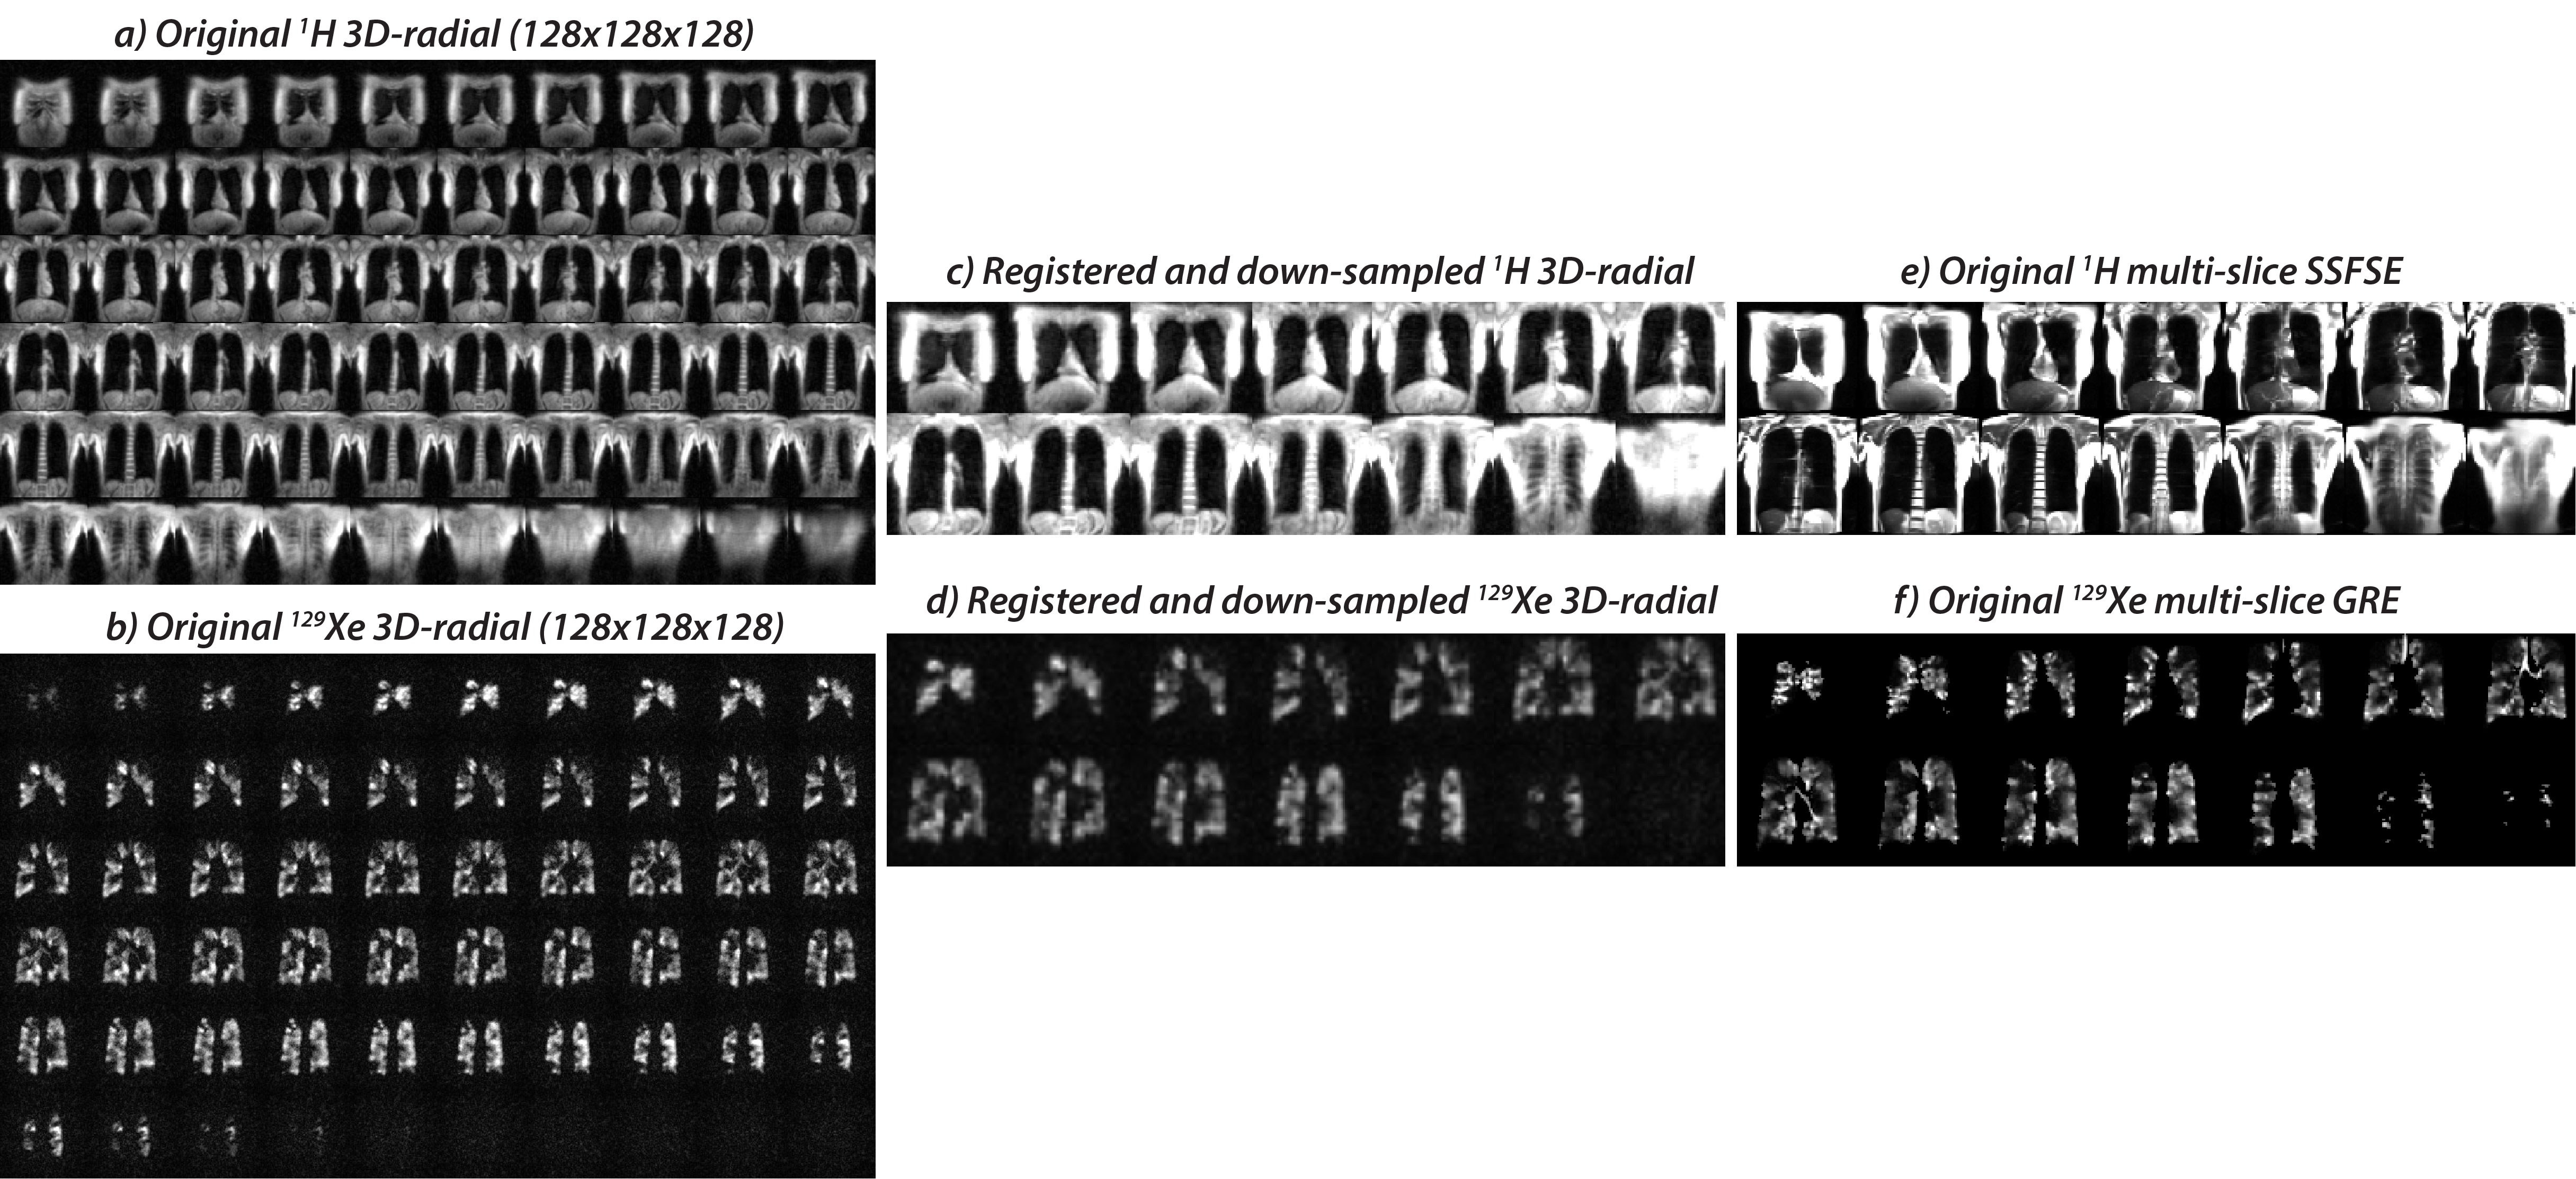
Figure 1. 3D-radial re-sampling and registration to the dedicated 1H and 129Xe multi-slice GRE ventilation space. a) To improve registration fidelity, the 1H multi-slice SSFSE images were first interpolated from their native resolution to 128x128x128. The 1H 3D-radial images (a) and 129Xe 3D-radial images (b) were then registered to this space, and then down-sampled to the same dimension (c-d) as the multi-slice 1H and 129Xe multi-slice images (e-f).
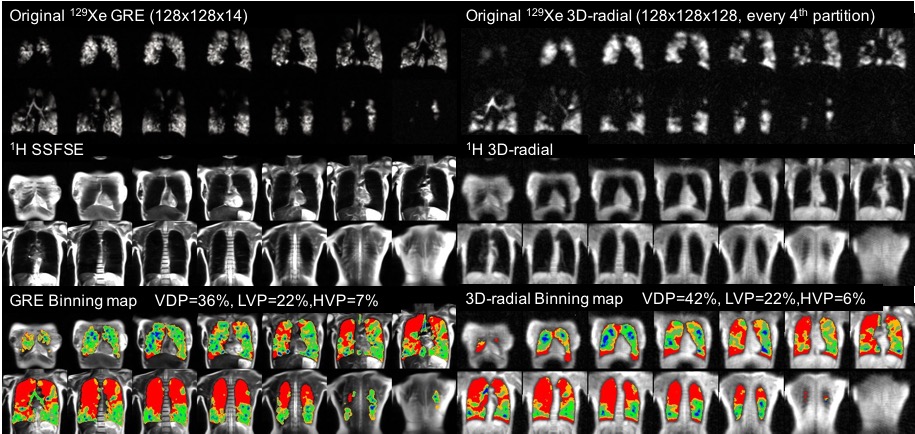
Figure 2. Comparing the multi-slice GRE images to the original 3D-radial images, along with associated binning maps for a COPD patient with FEV1=29%. The images show good visual agreement for VDP, LVP and HVP. Note, the 3D-radial are reconstructed with 128 partitions, but showing only every 4th one here.
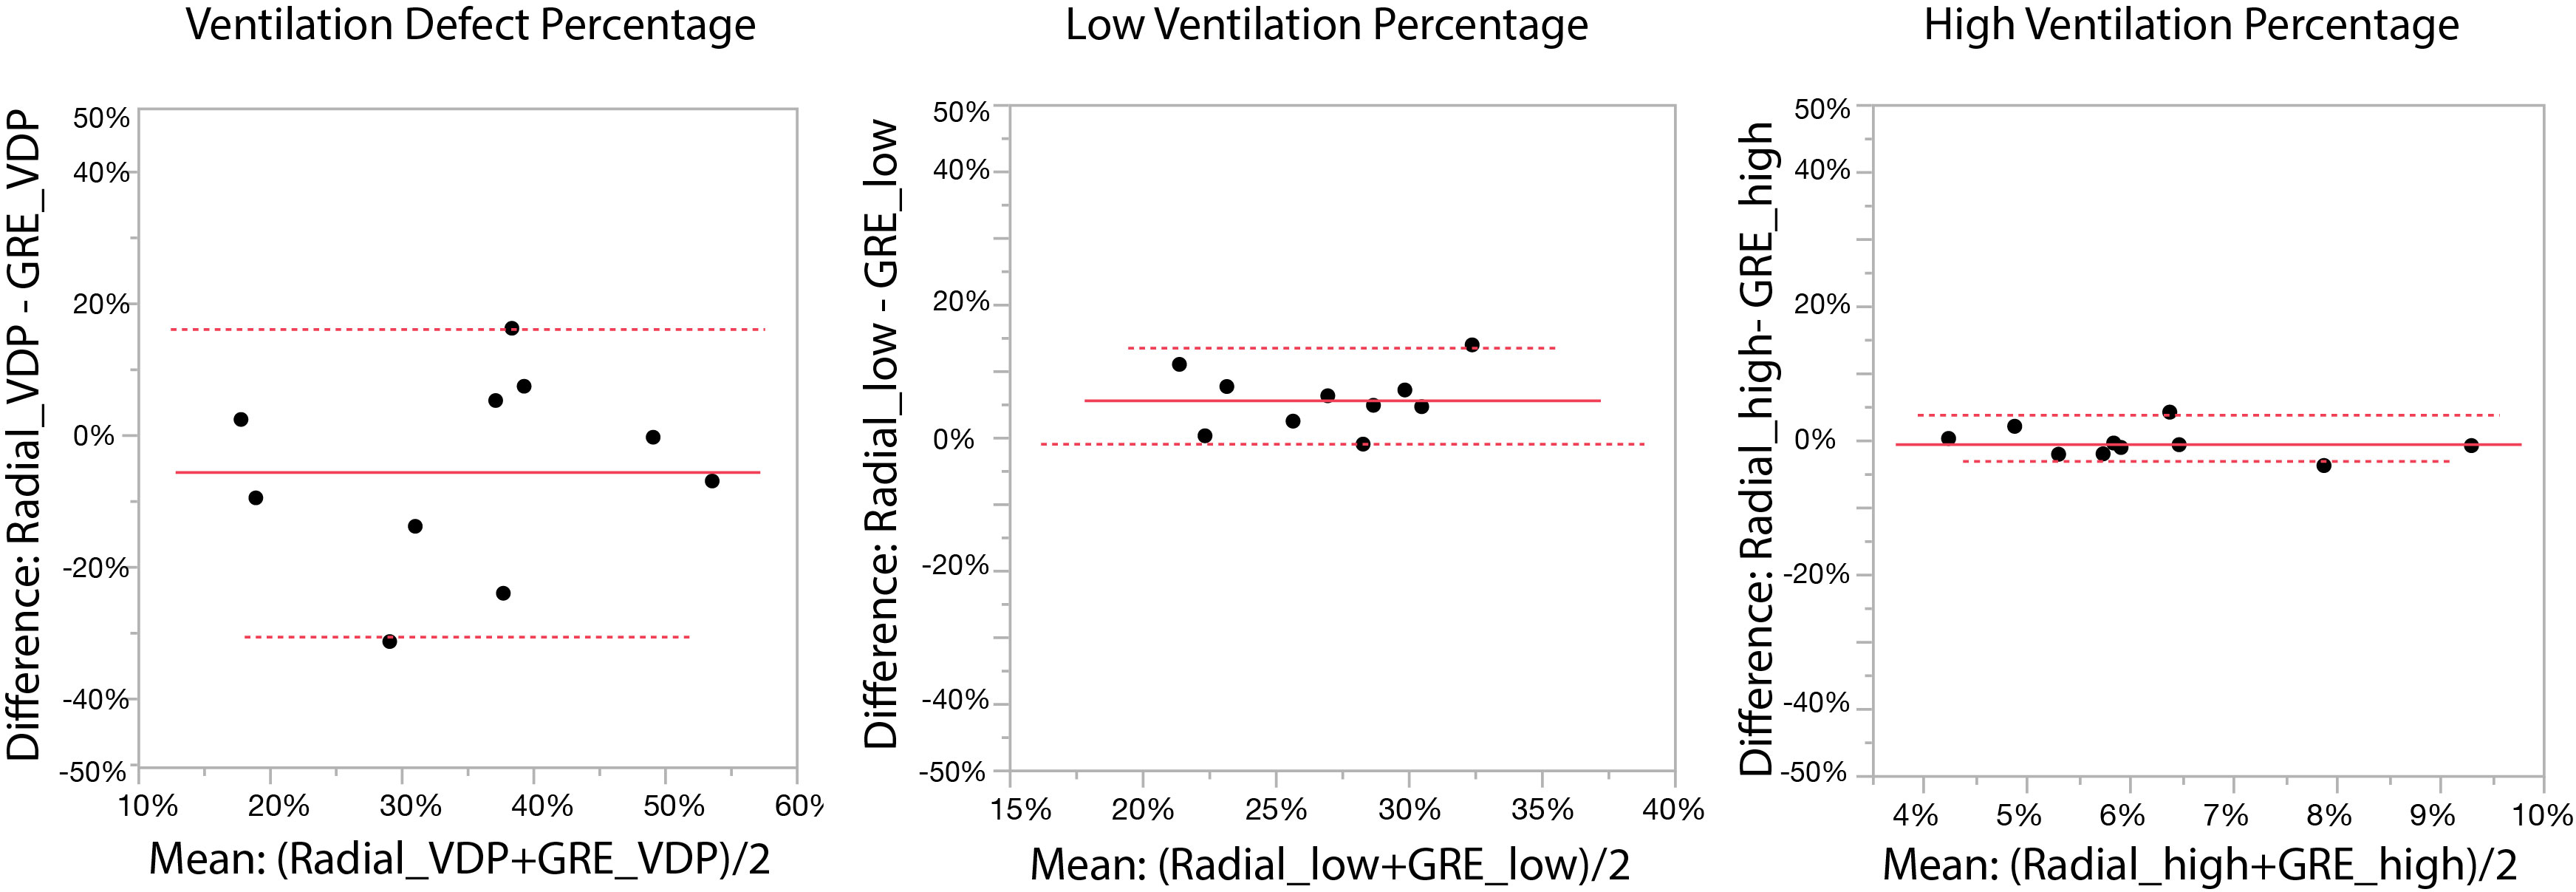
Figure 3. The limits of agreement between radial and GRE acquisitions for VDP were [-31% to 16%] with a -6% bias, for LVP were [-1% to 4%], with a +6% bias, and for HVP were [-2% to 1%] with a -0.5% bias.
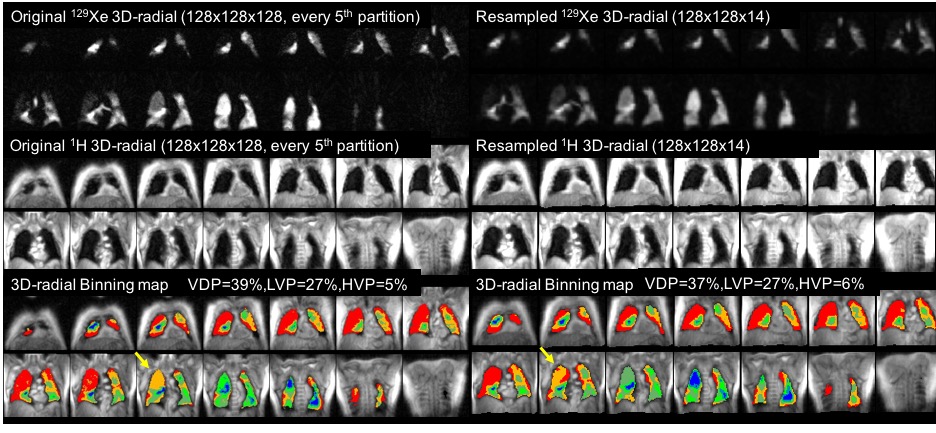
Figure 4. Representative 129Xe ventilation MRI and maps for the original vs registered and down-sampled 3D-radial images for a COPD patient (FEV1=66%). For the original vs resampled image, VDP, LVP and HVP were found to be 39% vs 37%, 27% vs 27%, and 5% vs 6%. The defect and low-ventilation regions on the right upper lobe are preserved after the resampling as indicated by the arrows.
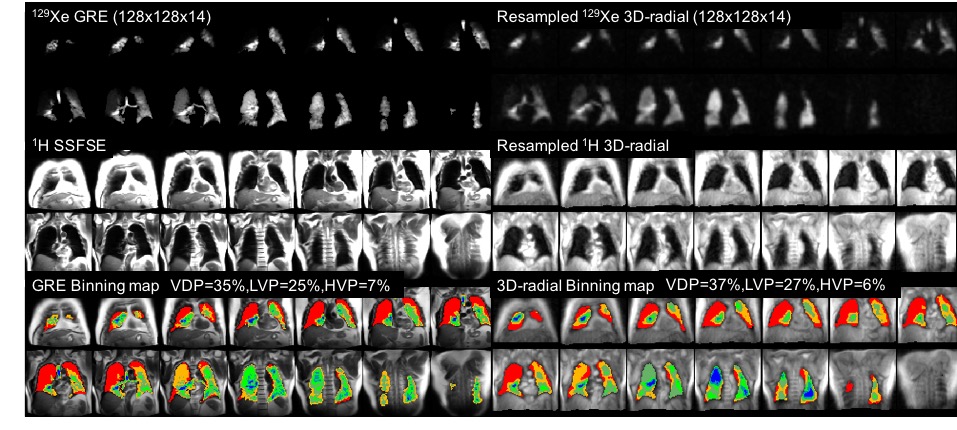
Figure 5. Comparison of the original multi-slice GRE 129Xe ventilation MRI to the registered, down-sampled 3D-radial images for the same patient shown in Figure 4. Although quantitative agreement for VDP, LVP and HVP are excellent, the dice coefficients are moderate for VDP (0.6) and poor for LVP and HVP (0.2).