0005
Hyperpolarised xenon-129 MR spectroscopy and diffusion-weighted xenon-129 MRI at baseline in patients with interstitial lung disease1The University of Sheffield, Sheffield, United Kingdom, 2Sheffield Teaching Hospitals NHS Foundation Trust, Sheffield, United Kingdom, 3The University of Manchester, Manchester, United Kingdom, 4The University of Manchester NHS Foundation Trust, Manchester, United Kingdom, 5Bioxydyn Ltd, Manchester, United Kingdom
Synopsis
Preliminary findings are presented from a prospective, longitudinal, multicentre MRI biomarker study of patients presenting with interstitial lung disease (ILD) including drug induced ILD, hypersensitivity pneumonitis, idiopathic pulmonary fibrosis and connective tissue disease ILD. At the time of writing, 27 patients have undergone baseline hyperpolarised xenon-129 (129Xe) MR spectroscopy (MRS) and 129Xe diffusion-weighted MRI. Our findings suggest significant differences in mean 129Xe apparent diffusion coefficient between the ILD subtypes at baseline but no significant differences in the red blood cell / tissue plasma ratio from dissolved 129Xe MRS. We also demonstrate correlation between pulmonary function tests and 129Xe MRI measures.
Introduction
Interstitial lung disease (ILD) incorporates a heterogeneous mix of lung diseases with various degrees of inflammation and fibrosis, which results in a reduction in gas exchange. Pulmonary function tests (PFTs) are insensitive to change in ILD, thus the need for more sensitive markers of lung structure-function is well recognised1. The proposed study is a prospective, multicentre, observational study of patients with ILD, including drug induced ILD (DI-ILD), hypersensitivity pneumonitis (HP), fibrotic ILD (idiopathic pulmonary fibrosis (IPF) or ILD secondary to rheumatoid arthritis) and connective tissue disease ILD (CTD-ILD).
Hyperpolarised xenon-129 (129Xe) MR spectroscopy (MRS) can be used as a quantitative marker of gas exchange and diffusion limitation in ILD as it exhibits three distinct resonance frequencies in the lung, corresponding to gaseous 129Xe and 129Xe dissolved in red blood cells (RBCs) and tissue/plasma (TP). The ratio of the uptake of 129Xe in the RBCs to uptake in the TP (RBC/TP ratio) has been shown to be reduced by 70% in IPF patients (0.16 ± 0.03) when compared to healthy volunteers (0.55 ± 0.13)2. A recent study found that the decline in RBC/TP ratio in IPF patients over 12 months was not accompanied by a significant change in carbon monoxide gas transfer factor (TLco) or carbon monoxide transfer coefficient (KCO)3.
The apparent diffusion coefficient (ADC) is a measure of Brownian diffusion of gas in the airspaces, where restrictions by tissue boundaries provide information about lung microstructure down to the alveolar level. Diffusion-weighted (DW) MRI of the lung with hyperpolarised helium in IPF patients has demonstrated that ADC correlates with KCO and regional fibrosis on CT4,5 but to date no data are available on the utility of 129Xe diffusion in ILD.
Methods
Patients with a new multi-disciplinary diagnosis of ILD underwent hyperpolarised 129Xe MRS and 129Xe DW-MRI. All imaging was performed on a 1.5 T GE HDx scanner with 600mL of 129Xe mixed with nitrogen to balance a total inhaled dose of 1L. A high-resolution MRS sequence was used to acquire MR spectra of 129Xe from the whole lungs and after individual zeroth-order phasing on the RBC and TP resonances, peak integrals were calculated to derive the RBC/TP ratio. A bandwidth of 1798 Hz was used with a repetition time of 160 milliseconds and a total acquisition time of five seconds. A 3D multiple b-value DW-MRI sequence (b=0, 12, 20, 30 s/cm2) was also acquired and maps of ADC were calculated from 129Xe DW-MRI for each imaging voxel using a mono-exponential fit of the first two DW b-values (b=0, 12 s/cm2)6. PFTs were performed within one week of the MRI scan. Spearman’s rho was used to determine the strength of correlations. Kruskal-Wallis test was used to determine statistical differences between the ILD subtypes for 129Xe MRS, 129Xe DW-MRI, forced vital capacity percent (FVC%) predicted and TLco% predicted. Significance was assumed at p<0.05 (uncorrected).Results
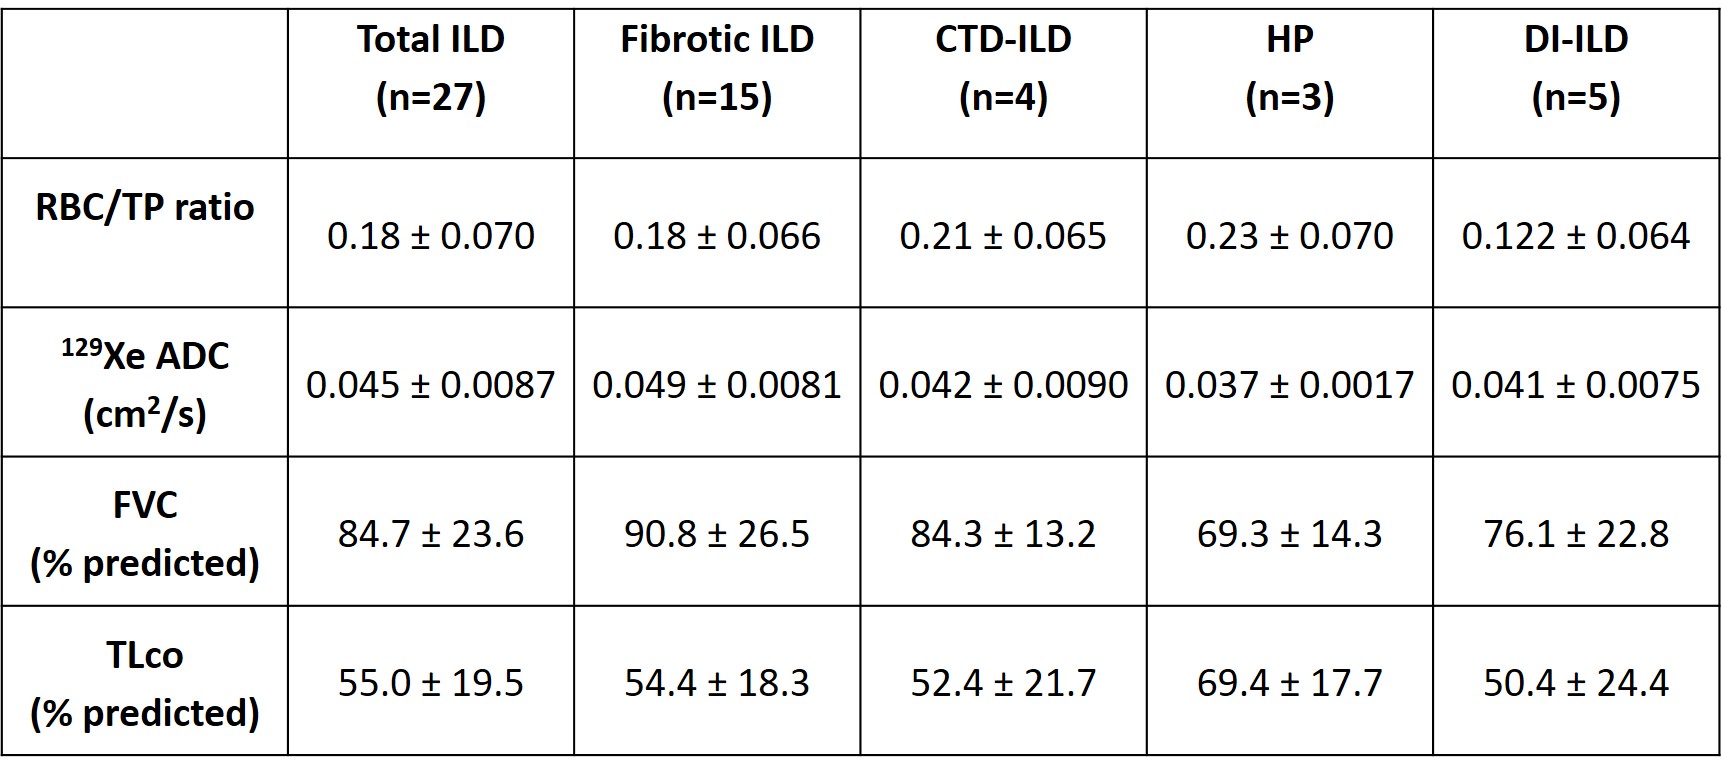
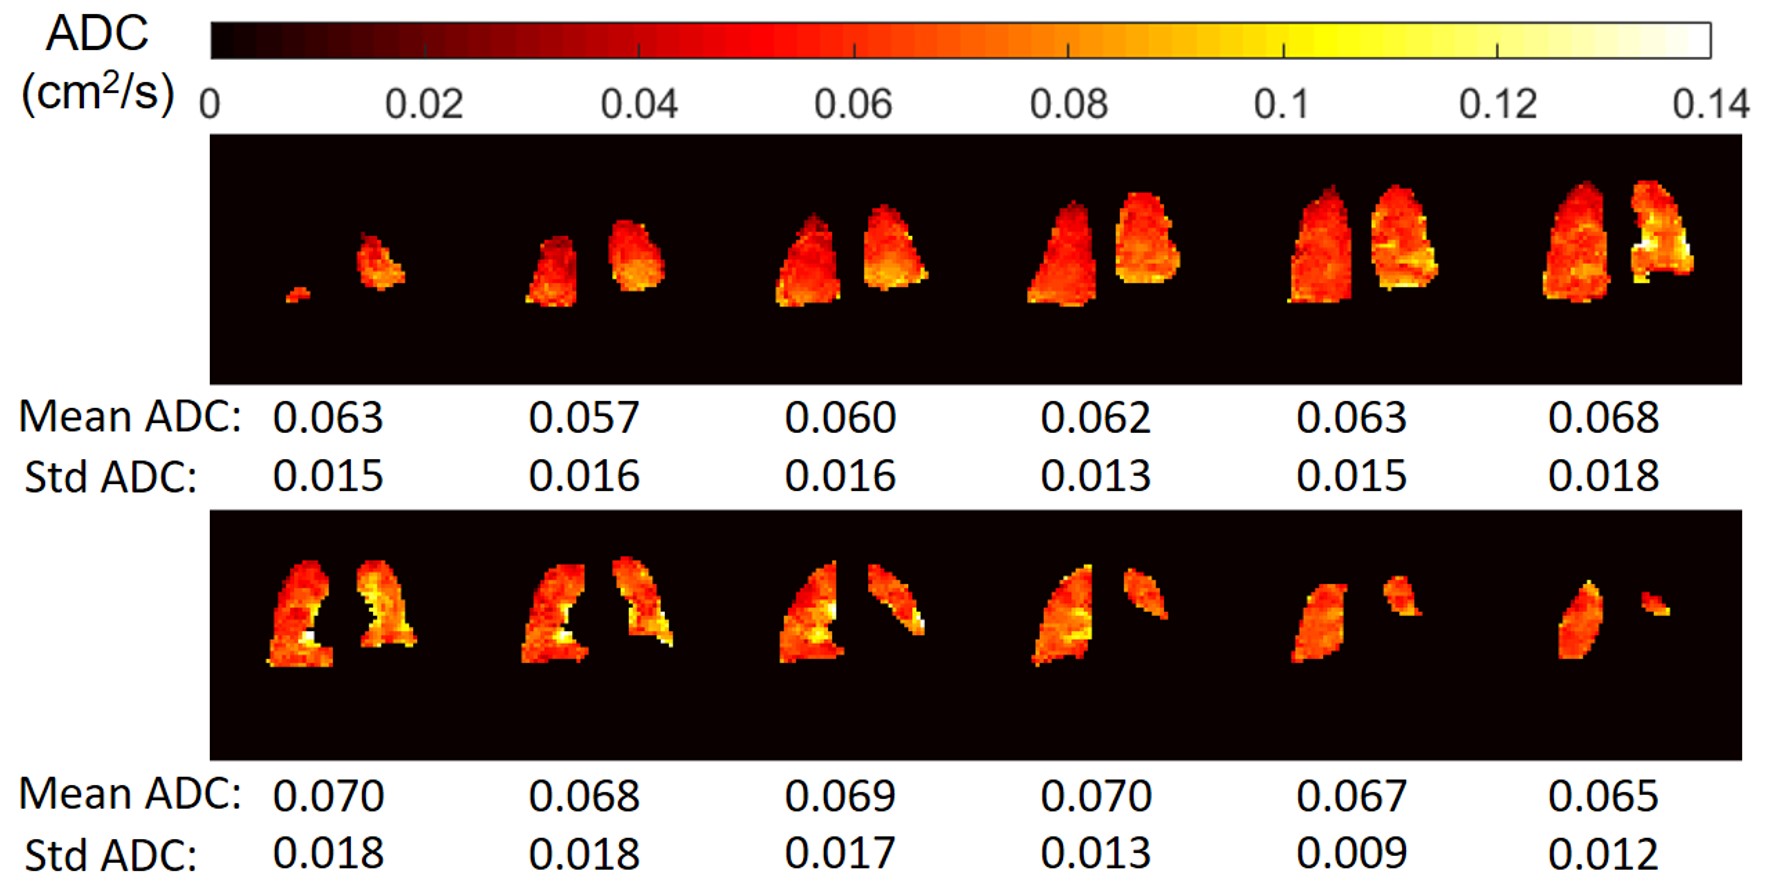
At the time of writing, 27 patients with ILD (5 DI-ILD, 3 HP, 15 fibrotic ILD, 4 CTD-ILD) have undergone baseline hyperpolarised 129Xe MRS and 129Xe DW-MRI. Mean and standard deviation of the RBC/TP ratio, 129Xe ADC, FVC% predicted and TLco% predicted at baseline for the combined ILD groups and each ILD subtype are summarized in Table 1. Figure 1 is an example of the 129Xe ADC maps from a study patient with IPF at baseline.
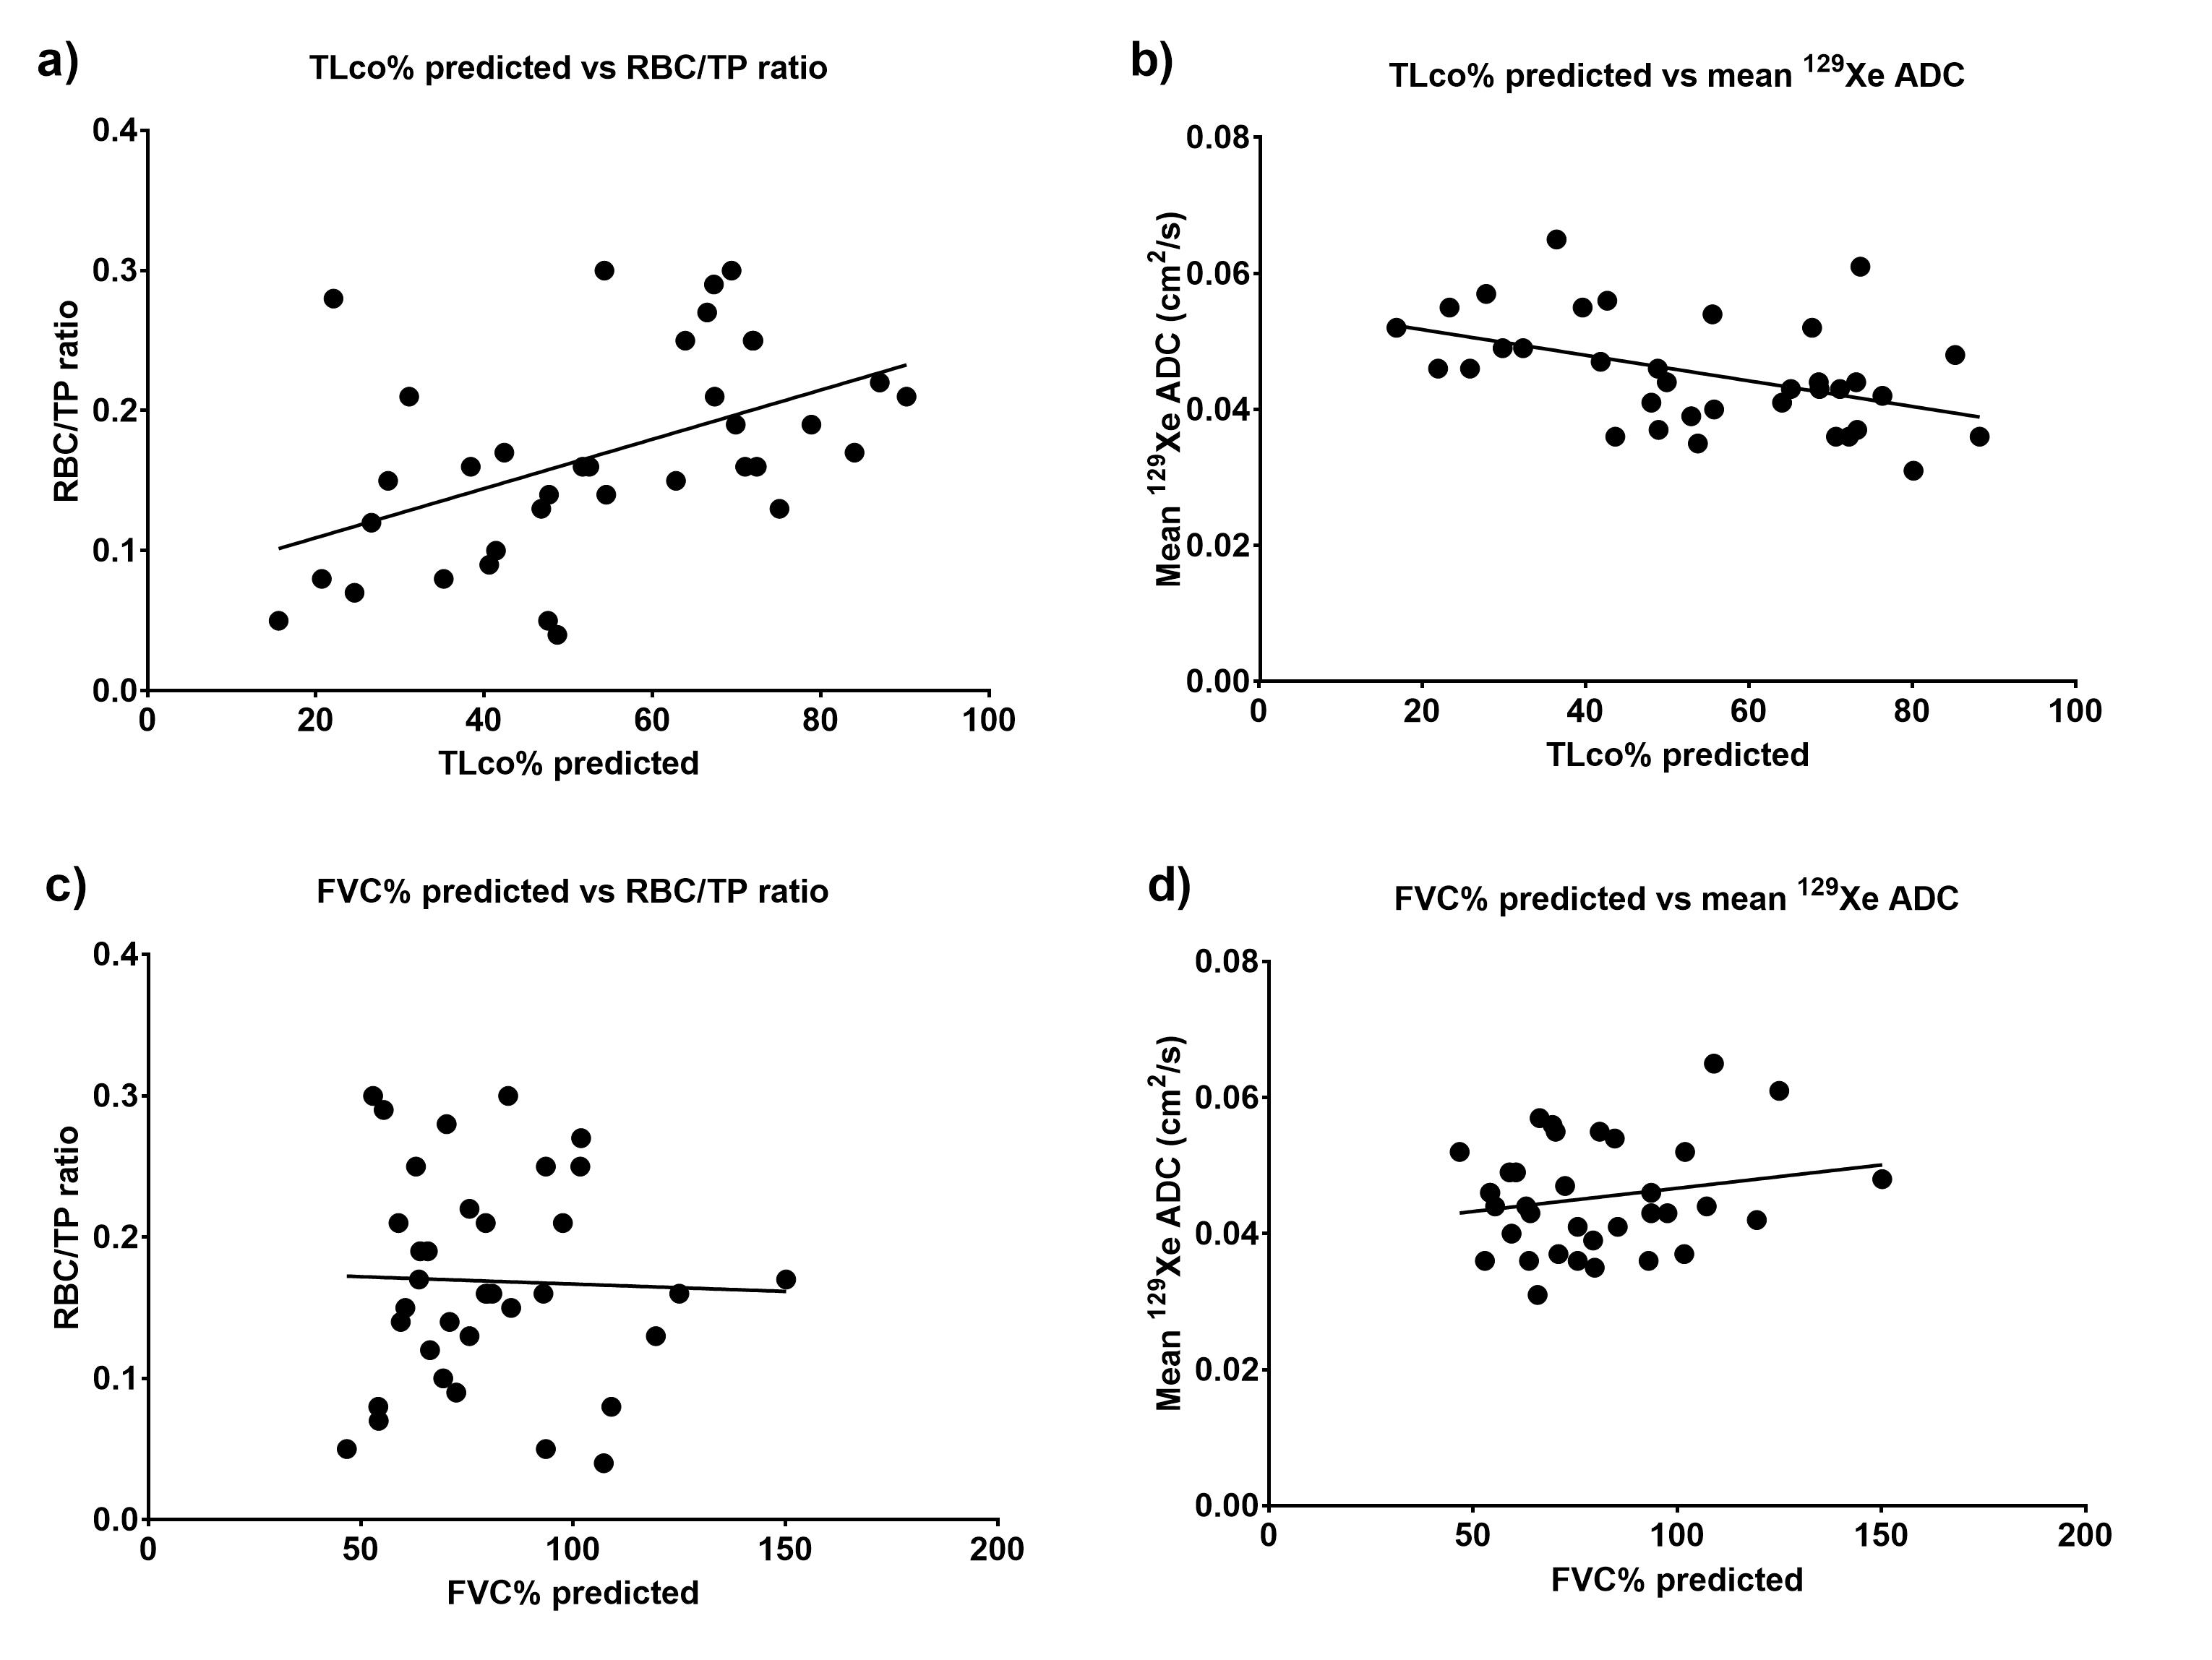
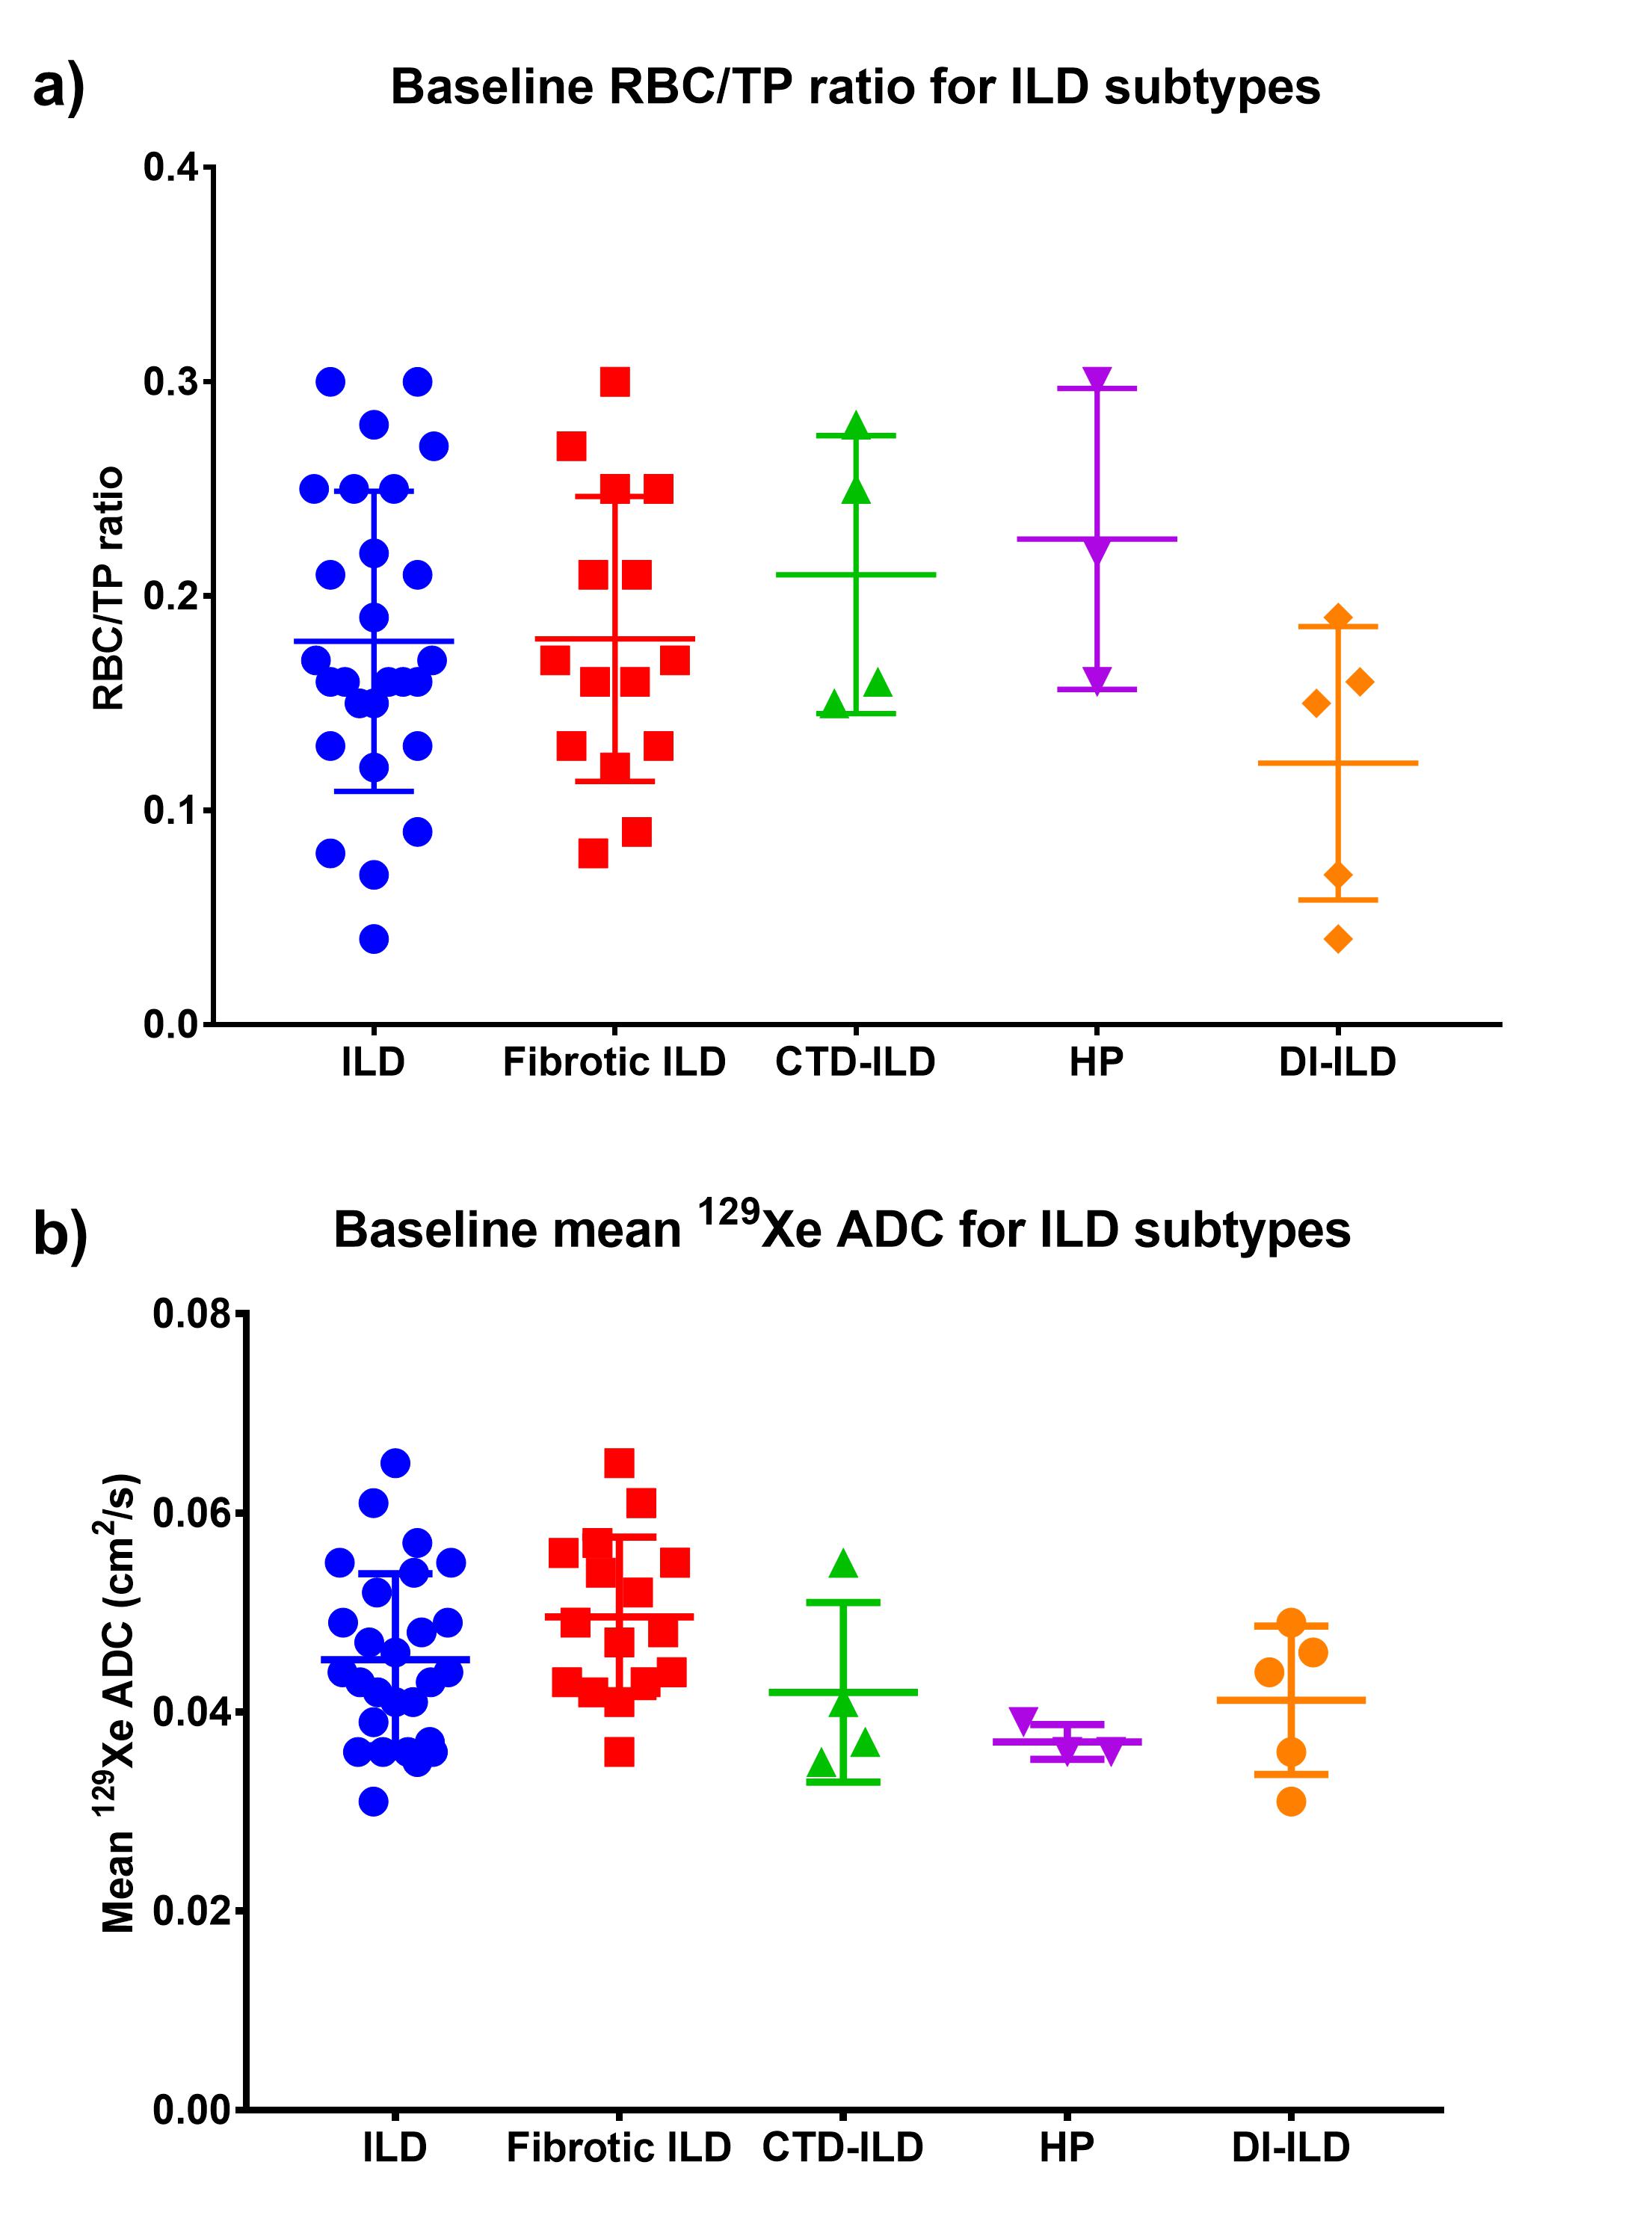
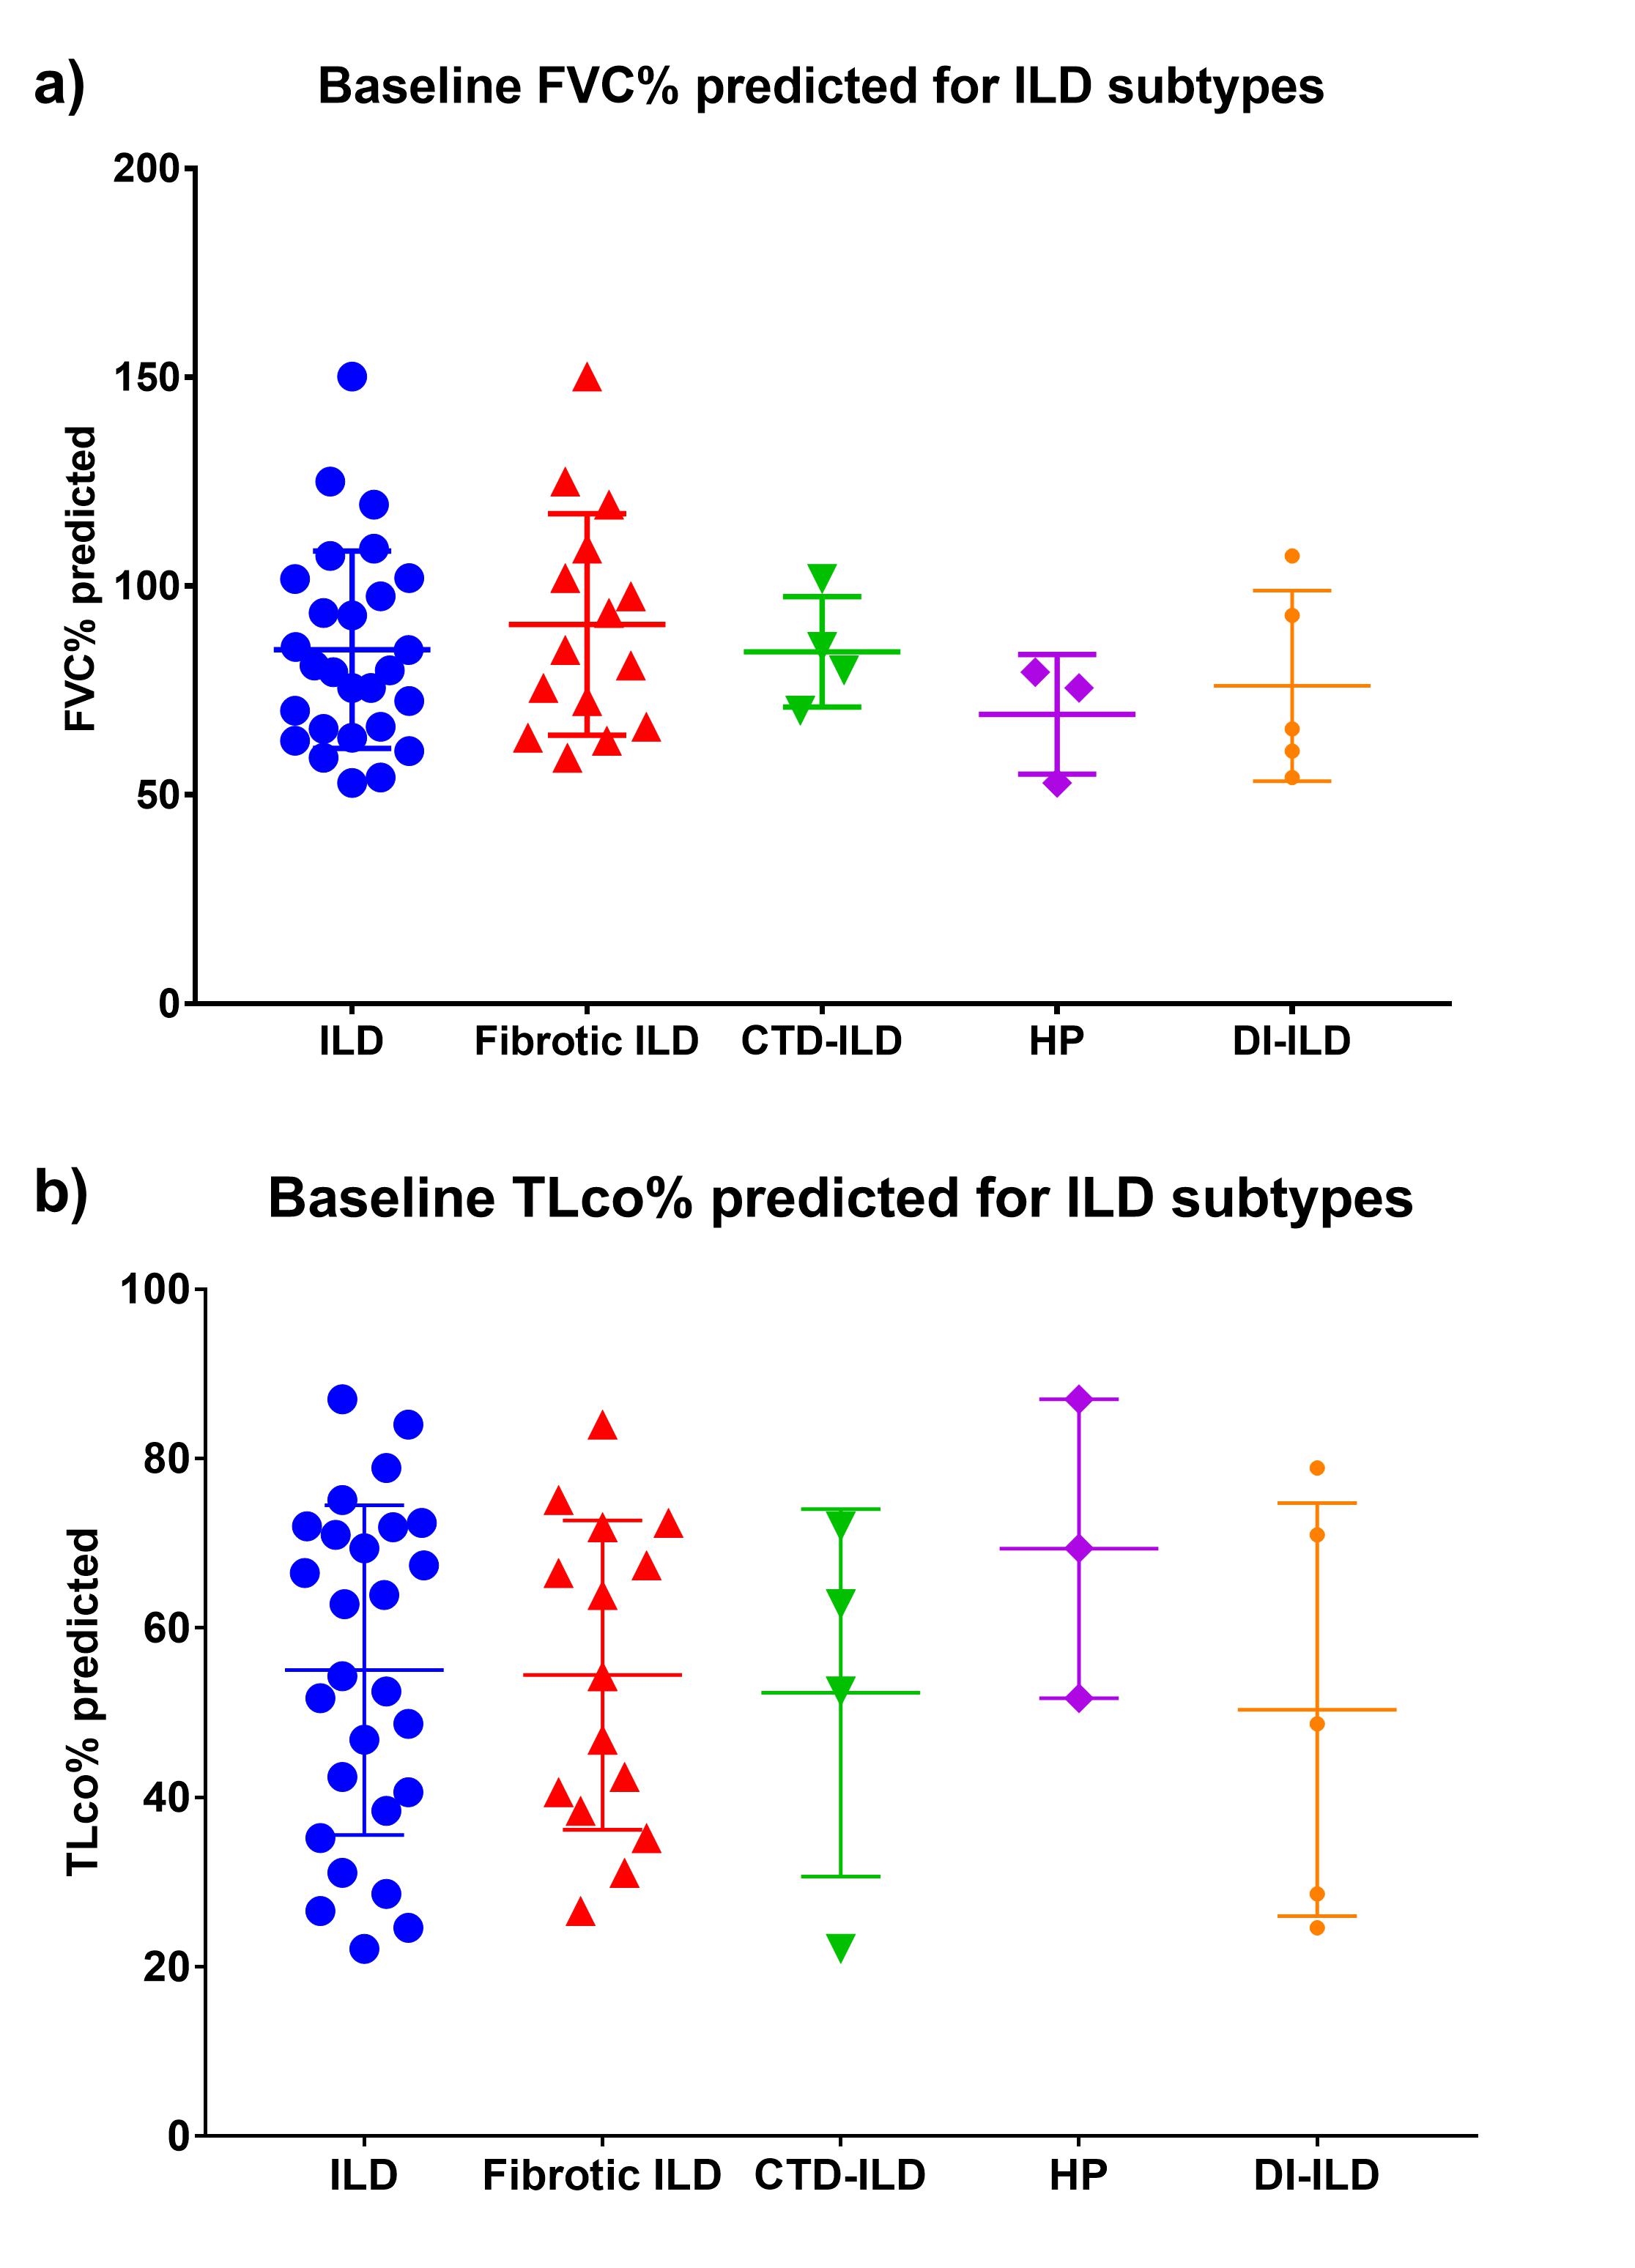
Significant correlations were found between RBC/TP ratio and TLco% predicted (r=0.51; p=0.0014) but not with FVC% predicted (r=0.001, p=0.99), as shown in Figure 2a,c. Significant correlations were found between mean 129Xe ADC and TLco% predicted (r=0.49; p=0.0029) but not with FVC% predicted (r=0.099, p=0.57), as demonstrated in Figure 2b,d. Kruskal-Wallis test confirmed that RBC/TP ratio (p=0.19) was not significantly different between the ILD subtypes but mean 129Xe ADC (p=0.036) was significantly different, as shown in Figure 3. Kruskal-Wallis test confirmed that FVC% predicted (p=0.37) and TLco% predicted (p=0.64) were not significantly different between the ILD subtypes, as demonstrated in Figure 4.
Discussion
Our preliminary findings confirm previous findings of a correlation between RBC/TP ratio and TLco2. In addition, we have demonstrated a correlation between mean 129Xe ADC and TLco. Our findings suggest significant differences in mean 129Xe ADC between the ILD subtypes at baseline but no significant differences in RBC/TP ratio. We plan to perform longitudinal assessment of all patients scanned at baseline with repeat 129Xe MRS and 129Xe DW-MRI at six weeks in the DI-ILD and HP patients and at six months in the fibrotic ILD and CTD-ILD groups and evaluate the 129Xe MRI metrics against those from DCE-MRI, OE-MRI and 3D-UTE structural MRI.Acknowledgements
The research leading to these results received funding from the Innovative Medicines Initiatives 2 Joint Undertaking under grant agreement No 116106. This Joint Undertaking receives support from the European Union’s Horizon 2020 research and innovation programme and EFPIA.References
- Wild JM. Imaging pathophysiological changes in the lungs in IPF with xenon magnetic resonance imaging. Thorax, 2018; 73:1.
- Kaushik SS, et al. Measuring diffusion limitation with a perfusion limited gas – Hyperpolarized 129Xe gas-transfer spectroscopy in patients with idiopathic pulmonary fibrosis. J Appl Physiol, 2014; 117:577-585.
- Weatherley ND, et al. Hyperpolarized 129Xe MR spectroscopy detects short-term changes in lung gas exchange efficiency in idiopathic pulmonary fibrosis. Proc ISMRM, 2018: 0966.
- Weatherley N, et al. Diffusion-weighted hyperpolarised gas MRI in idiopathic pulmonary fibrosis: Reproducibility and clinical significance. Eur Respir J, 2016; 48: OA3504.
- Weatherley ND, et al. Assessment of acinar destruction in idiopathic pulmonary fibrosis with hyperpolarised 3He gas diffusion-weighted MRI: reproducibility of ADC metrics and correlation with physiological parameters of disease severity. Proc ISMRM, 2017: 3328.
- Chan HF, et al. 3D Diffusion-Weighted 129Xe MRI for Whole Lung Morphometry. Magn Reson Med, 2018; 79:2986–2995.
Figures