0004
Using 129Xenon MR Imaging and Spectroscopic Signatures to Differentiate Pulmonary Arterial Hypertension from Other Cardiopulmonary Diseases1Biomedical Engineering, Duke University, Durham, NC, United States, 2Center for In Vivo Microscopy, Duke University, Durham, NC, United States, 3Department of Medicine, Duke University Medical Center, Durham, NC, United States, 4Electrical and Computer Engineering, Duke University, Durham, NC, United States, 5Radiology, Duke University Medical Center, Durham, NC, United States, 6Biostatistics & Bioinformatics, Duke University Medical Center, Durham, NC, United States, 7Division of Cardiology, Department of Medicine, Duke University Medical Center, Durham, NC, United States
Synopsis
This work sought to identify a non-invasive means to detect pulmonary arterial hypertension (PAH). 129Xenon MRI and dynamic spectroscopy were acquired in healthy volunteers and subjects with chronic obstructive pulmonary disease (COPD), idiopathic pulmonary fibrosis (IPF), left heart failure (LHF), and PAH. COPD was differentiated from PAH by increased ventilation and barrier defects, while IPF was differentiated by increased barrier uptake. PAH and LHF subjects had similar imaging features but could be differentiated by their RBC signal oscillation amplitudes. 129Xe MR imaging and spectroscopy appears capable of differentiating PAH from COPD, IPF, and LHF.
Purpose:
Unexplained dyspnea poses a significant problem for both patients and healthcare systems and is frequently worked up using invasive procedures. For example, a surgical lung biopsy may be performed to evaluate for interstitial lung disease or a right heart catheterization to evaluate for pulmonary arterial hypertension (PAH). Moreover, as more patients present with multiple co-morbidities it becomes increasingly difficult to determine whether PAH is contributing to their dyspnea and, thus, their optimal course of treatment. This problem may be addressed by combining 129Xe MR imaging to quantify regional gas exchange impairment with 129Xe spectroscopy to characterize cardiopulmonary dynamics. This work therefore sought to determine whether a non-invasive 129Xe MR study could identify signatures of regional gas exchange impairment and altered hemodynamics that differentiate PAH from other frequent causes of dyspnea, including chronic obstructive pulmonary disease (COPD), idiopathic pulmonary fibrosis (IPF), and left heart failure (LHF).Methods:
The study included 22 healthy volunteers, 8 patients with COPD, 12 with IPF, 6 with LHF, and 10 with PAH. 129Xe imaging and spectroscopy were acquired on either a 1.5 GE 15M4 EXCITE or a 3T SIEMENS MAGNETOM Trio MRI scanner.
For each subject, 3D images were reconstructed from 1000 views each of an interleaved radial acquisition of gas- and dissolved-phase data during a breath hold. Acquisition used TR=15ms, flip angle of 0.5/20°, an echo time at which the two dissolved compartments were 90° out of phase (TE90) to permit decomposition, using the 1-point Dixon method, into RBC and barrier images.1 The images were converted into binning maps depicting 129Xe ventilation, barrier tissue uptake, and red blood cell (RBC) uptake.2 The three maps were quantified into percentages of the thoracic cavity exhibiting ventilation defect (VDP), barrier defect (BDP), high barrier (BHP), and RBC defect (RDP).3
Subjects underwent additional dynamic spectroscopy in which 129Xe free induction decays (FIDs) were collected every 20ms (TE=0.932ms, flip angle≈20°, dwell time=32µs, 512/1024 points). The FIDs from the breath-hold period were fit in the time domain to a model with 1 Voigt (barrier) and 2 Lorentzian (RBC and gas) peaks. The time-dependent RBC signal amplitude and chemical shift were detrended and their cardiogenic oscillations were quantified by peak-to-peak amplitude.4
All statistics were performed using the Kruskal-Wallis test to test for differences between groups, and the Wilcoxon rank sum test for pairwise comparison.
Results:
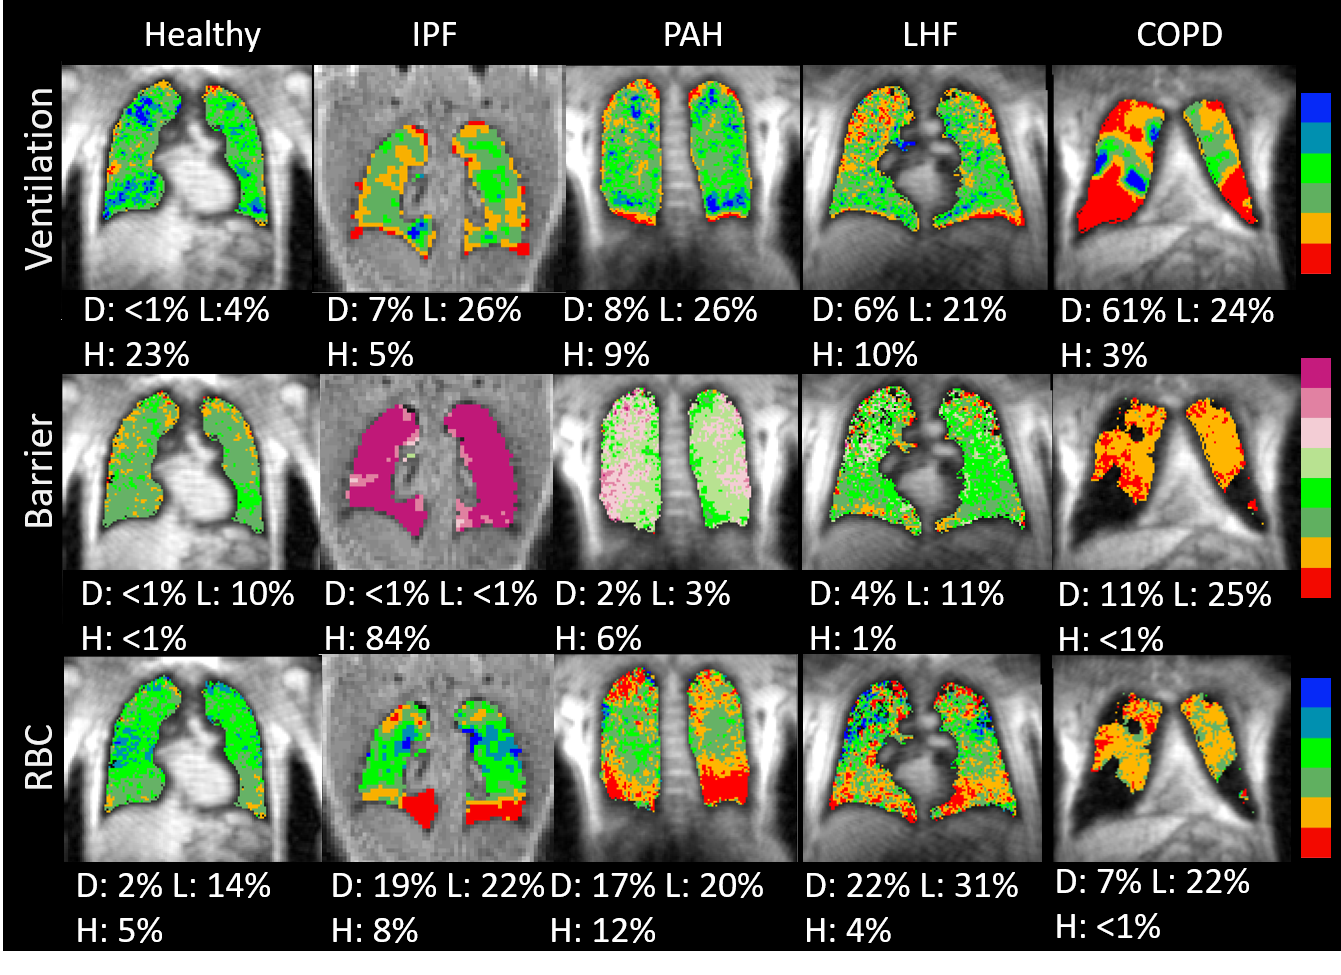
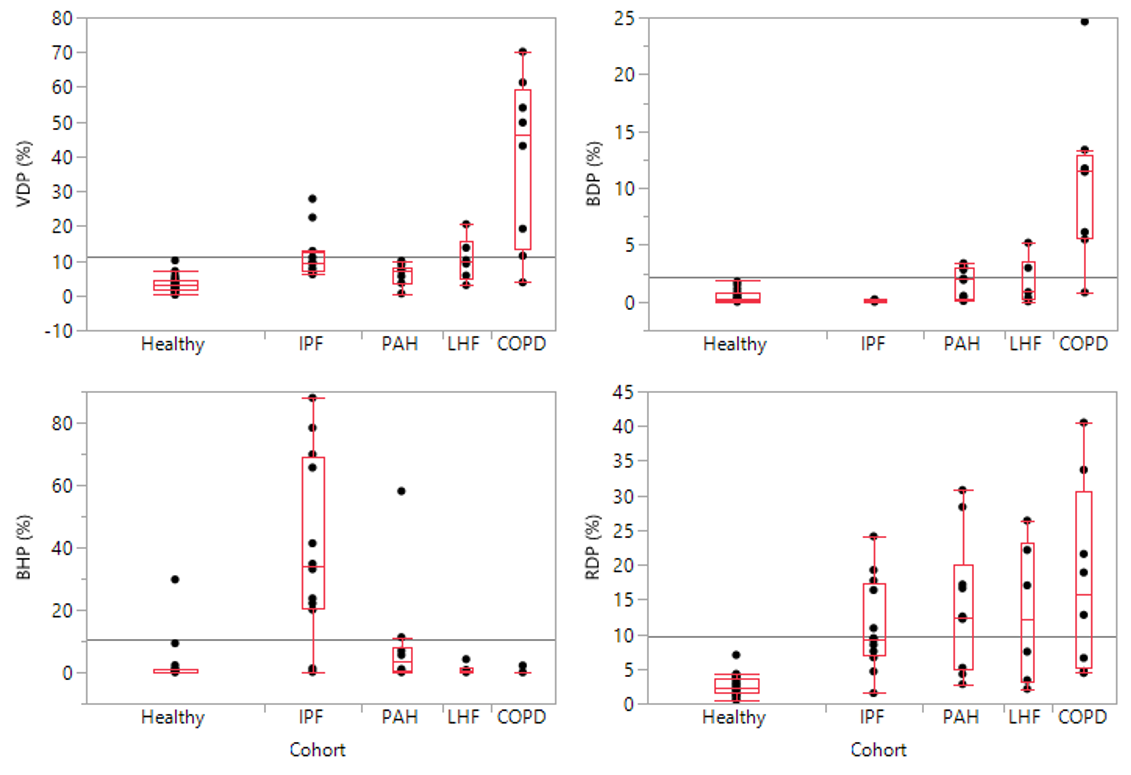
Figure 1 shows ventilation and gas exchange maps for one representative subject from each cohort, and the quantitative imaging metrics for all subjects are compared in Figure 2. Compared to healthy volunteers, all disease cohorts exhibited increased VDP and RDP (p<0.001 and p<0.001). COPD patients exhibited significantly higher VDP and BDP compared to all other groups (VDP=39.0±24.5%, p<0.0001; BDP=10.6±7.1%, p<0.0001). IPF patients exhibited elevated barrier uptake compared to all other cohorts (BHP=39.8±29.3%, p<0.001). PAH and LHF present with similar imaging characteristics to one another and exhibit mildly elevated VDP (PAH=6.2%, p=0.01; LHF=10.4%, p=0.006; vs healthy=3.4%) and modestly elevated RDP (PAH=14.2±9.4%, p<0.001; LHF=13.0±10.2%, p=0.01; vs healthy=2.6±1.5%).
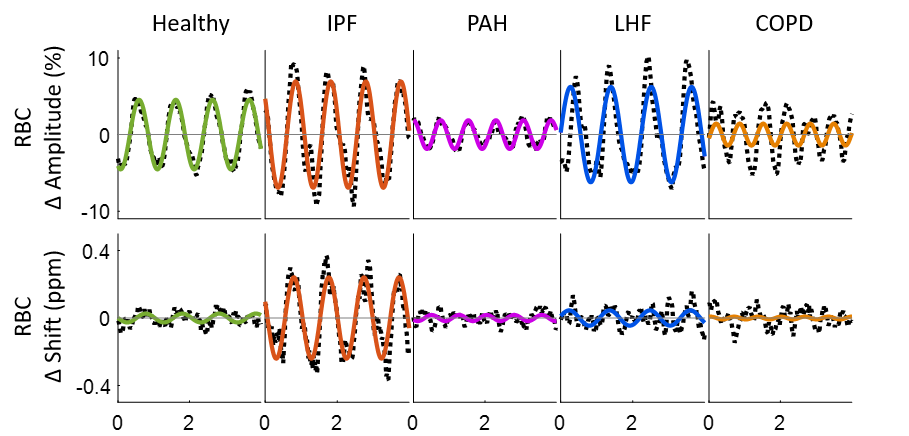
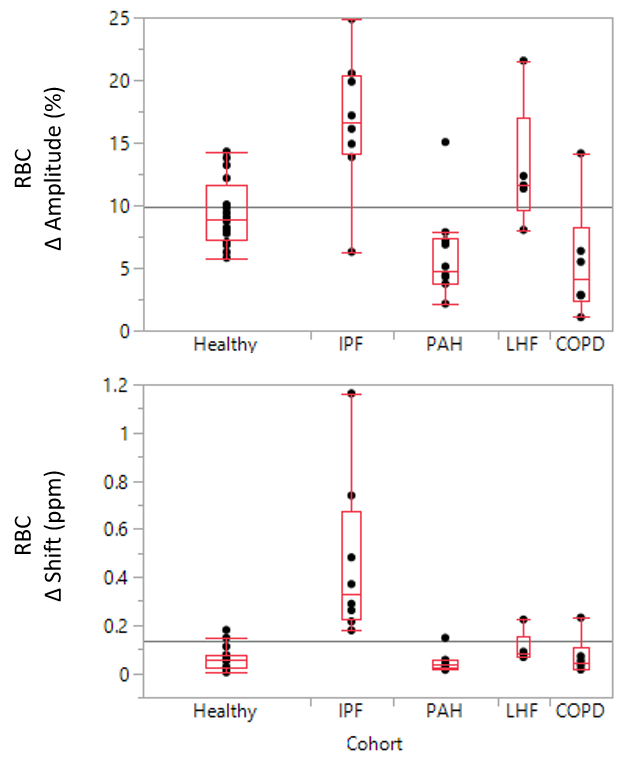
Figure 3 shows the detrended RBC signal amplitude and chemical shift oscillations for these representative subjects, which are compared statistically in Figure 4. Compared to both healthy volunteers (9.4±2.7%, p=0.01), and LHF (13.0±5.1%, p=0.007), PAH presents with diminished RBC oscillations (6.0±3.6%). IPF is the only cohort to exhibit significant RBC chemical shift oscillations.
Discussion:
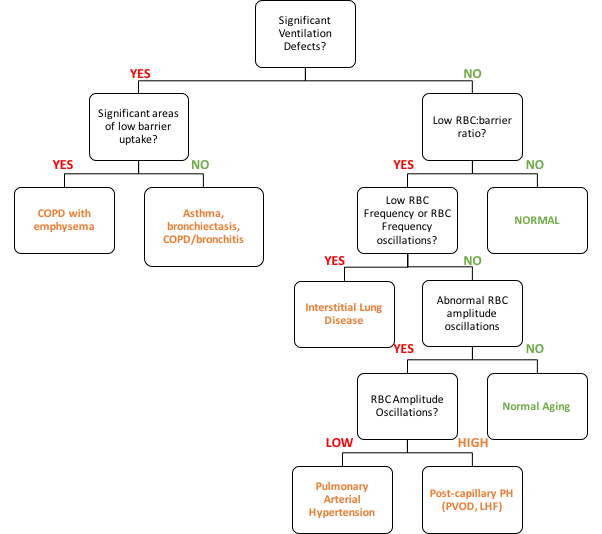
Imaging indicates that all diseases have a compound effect on both ventilation and RBC transfer relative to healthy subjects. Both COPD and IPF are distinguishable from the other cohorts by imaging metrics; COPD is characterized by elevated VDP and BDP, while IPF exhibits elevated BHP. However, PAH and LHF are indistinguishable on imaging, and it is only the dynamic spectroscopy that provides the additional cardiopulmonary dynamics that permit them to be differentiated. Specifically, PAH is caused by occlusions upstream of the pulmonary capillary bed, thus creating impedance to flow and diminishing the RBC signal oscillations. By contrast in post-capillary conditions such as LHF, high-impedance occurs downstream of the capillaries, and signal oscillations are enhanced. The RBC frequency oscillations uniquely seen in IPF are hypothesized to reflect delayed oxygenation.4 Together, these metrics permit the application of a diagnostic algorithm such as illustrated in Figure 5 to determine the underlying causes of dyspnea.Conclusion:
129Xe MR imaging and spectroscopy are potentially powerful, non-invasive diagnostic tools for identifying pulmonary vascular disease in the setting of other pulmonary and cardiac co-morbidities. Future efforts will involve refining the diagnostic criteria proposed here and testing them in a blinded fashion against gold standard cardiac catheterization.Acknowledgements
NIH/NHLBI R01 HL105643, NIH/NHLBI R01HL126771, and HHSN268201700001CReferences
(1) Kaushik SS, Robertson SH, Freeman MS, He M, Kelly KT, Roos JE, Rackley CR, Foster WM, McAdams HP, and Driehuys B. (2016), Single‐breath clinical imaging of hyperpolarized 129xe in the airspaces, barrier, and red blood cells using an interleaved 3D radial 1‐point Dixon acquisition. Magn. Reson. Med., 75: 1434-1443. doi:10.1002/mrm.25675
(2) Wang Z, Robertson, SH, Wang J, He M, Virgincar RS, Schrank GM, Bier EA, Rajagopal S, Huang YC, O'Riordan TG, Rackley CR, McAdams HP and Driehuys B. (2017), Quantitative analysis of hyperpolarized 129Xe gas transfer MRI. Med. Phys., 44: 2415-2428. doi:10.1002/mp.12264
(3) Wang Z, He M, Bier EA, Rankine L, Schrank G, Rajagopal S, Huang YC, Kelsey C, Womack S, Mammarappallil J, Driehuys B. (2018). Hyperpolarized 129Xe gas transfer MRI: The transition from 1.5T to 3T. Magnetic Resonance in Medicine. 10.1002/mrm.27377.
(4) Bier EA, Robertson SH, Schrank G, Rackley C, Mammarappallil JG, Rajagopal S, McAdams HP, Driehuys B. A Robust Protocol for Quantifying Cardiogenic Oscillations in Dynamic 129Xe Gas Exchange Spectroscopy: The Effects of Idiopathic Pulmonary Fibrosis NMR Biomed In Press 2018.
Figures