0001
FEV1/FVC Mapping with Dynamic MRI - A New Regional Lung Function Test1Institute of Diagnostic and Interventional Radiology, Hannover Medical School, Hannover, Germany, 2Biomedical Research in Endstage and Obstructive Lung Disease Hannover (BREATH), German Center for Lung Research (DZL), Hannover, Germany
Synopsis
Pulmonary function parameters like the ratio of expiratory volume in one second (FEV1) and forced vital capacity (FVC) are the current gold standard for disease diagnosis and monitoring. However, early disease detection remains limited due to missing regional information. In this study the forced expiratory maneuver was captured with a dynamic MRI acquisition, as used in Fourier decomposition or phase-resolved functional lung imaging (PREFUL), for FEV1/FVC mapping. Results were compared with spirometry, PREFUL and hyperpolarized MRI in four healthy subjects and one patient with cystic fibrosis and suggest a potentially increased sensitivity in comparison with the tidal breathing approach.
Introduction
Pulmonary function tests (PFT), including forced expiratory volume in one second (FEV1) and forced vital capacity (FVC) ratio, are the current gold standard for pulmonary disease diagnosis and monitoring1. Despite long-term experience and widespread clinical availability, the need for new more sensitive methods with regional information is evident2. Methods like Fourier decomposition (FD)3 or phase-resolved functional lung imaging (PREFUL)4 offer the possibility to assess regional ventilation via fractional ventilation (FV) utilizing a dynamic acquisition. A recent study showed the possible added value of transferring PFT concepts like flow / volume curves to MRI using PREFUL in patients with chronic obstructive pulmonary disease (COPD)5. Expanding on this idea, a PREFUL acquisition in combination with a forced breathing maneuver is employed to show the feasibility of regional FEV1/FVC Mapping.Methods
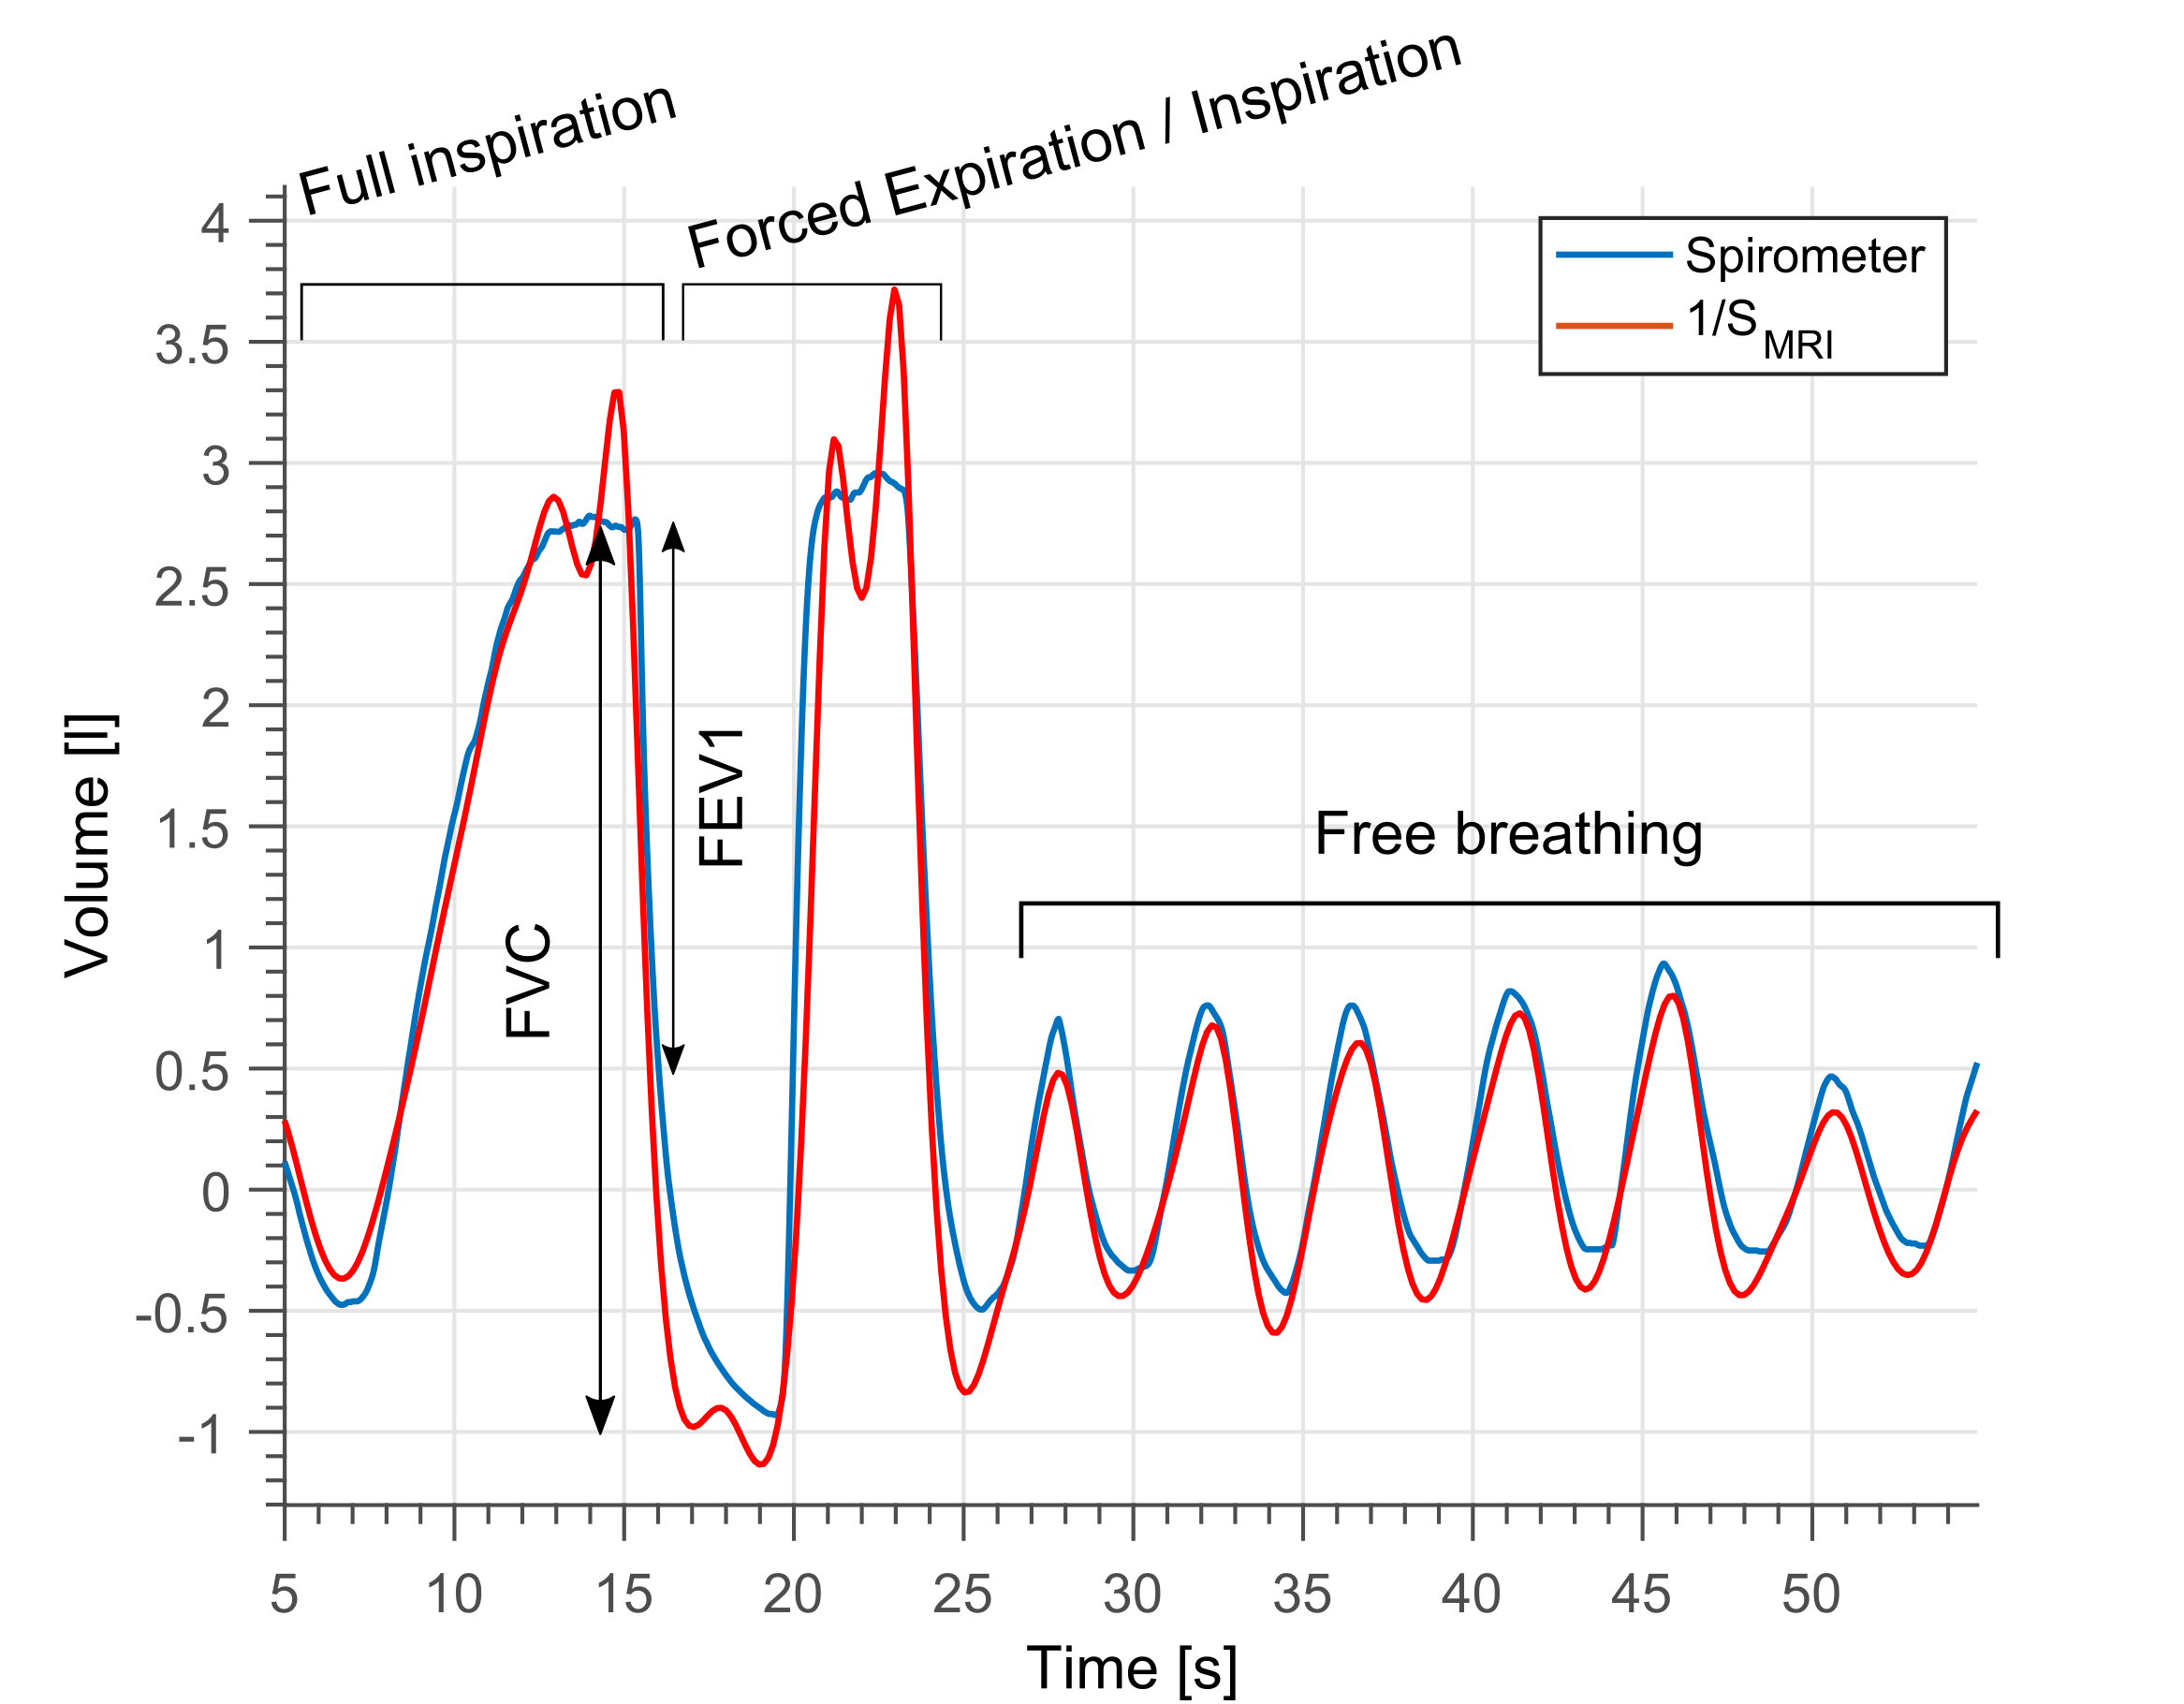
Acquisition: Four healthy volunteers (age range 26-31) and one patient with cystic fibrosis (CF, female, 18 years) were included in the study. All images were acquired on a 1.5T scanner with the subjects being in supine position. The protocol included one coronal slice scan located at tracheal bifurcation using a spoiled gradient echo sequence with the following parameters: TE 0.83 ms, TR 2.16 ms, FA 5°, matrix 128 x 128, field of view 50 x 50 cm2, slice thickness 15 mm, 1500 bandwidth / pixel, GRAPPA with acceleration factor 2 and a temporal resolution of 138 ms. Each acquisition was accompanied by a simultaneous spirometer volume measurement. During the acquisition the subjects performed the following breathing maneuver: 1.) Maximal inspiration to total lung capacity (TLC), 2.) A forced expiration to residual volume (RV), 3.) Forced inspiration to TLC, 4) Free breathing till the end of acquisition (see Figure 1). As gold standard for ventilation imaging, the CF patient underwent an additional MRI exam with inhalation of 1L gas containing hyperpolarized 129Xe, starting from FRC, and breathhold acquisition using a TrueFISP sequence.
Post-Processing: For motion correction, non-rigid registration
was performed using advanced normalization tools (ANTs)6,7. Both measurement methods were
synchronized using cross-correlation. To derive the regional FEV1/FVC
measurement consider the volume definition:
$$\textrm{FEV1/FVC}_{\textrm{Spirometer}} = \frac{\textrm{V(0)} - \textrm{V(1)}}{\textrm{V(0)}-\textrm{V}_\textrm{min}},$$ with lung volume at TLC
V(0), lung volume after 1 s of forced expiration V(1) and residual volume Vmin.
Using the relationship V ~ 1/S with lung volume V and MRI signal S the regional
FEV1/FVC at voxel location x can be defined as follows: $$\textrm{FEV1/FVC}_\textrm{MRI} = \frac{1-\textrm{S(0,x)/S(1,x)}}{1-\textrm{S(0,x)/S}_\textrm{min}\textrm{(x)}},$$ The following
time-series in free breathing was evaluated with PREFUL to calculate FV and
ventilation phase. The later was quantified as time to peak (TTP) in % of
respiratory cycle.
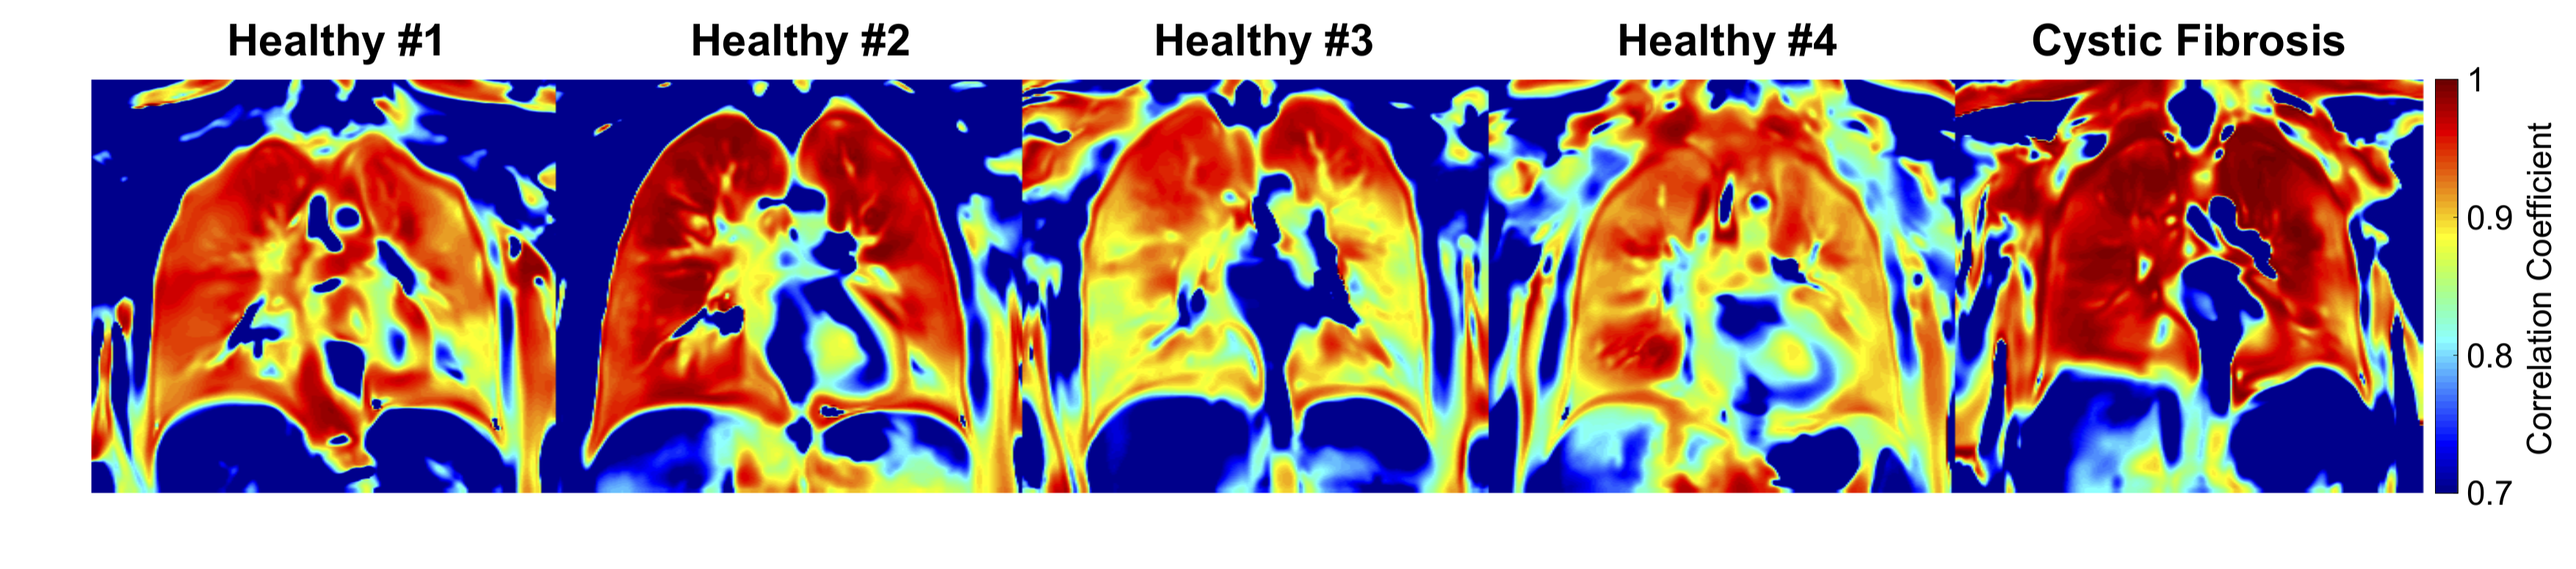
Quantitative analysis: Regional Pearson correlation
coefficient (CC) comparing V(t) and S(t,x) was calculated. The lung parenchyma was segmented as region of interest
(ROI) by manual segmentation. Using this ROI, median and interquartile range of
FEV1/FVCMRI, FV and CC were calculated and compared among themselves
and with FEV1/FVCSpirometer.
Results
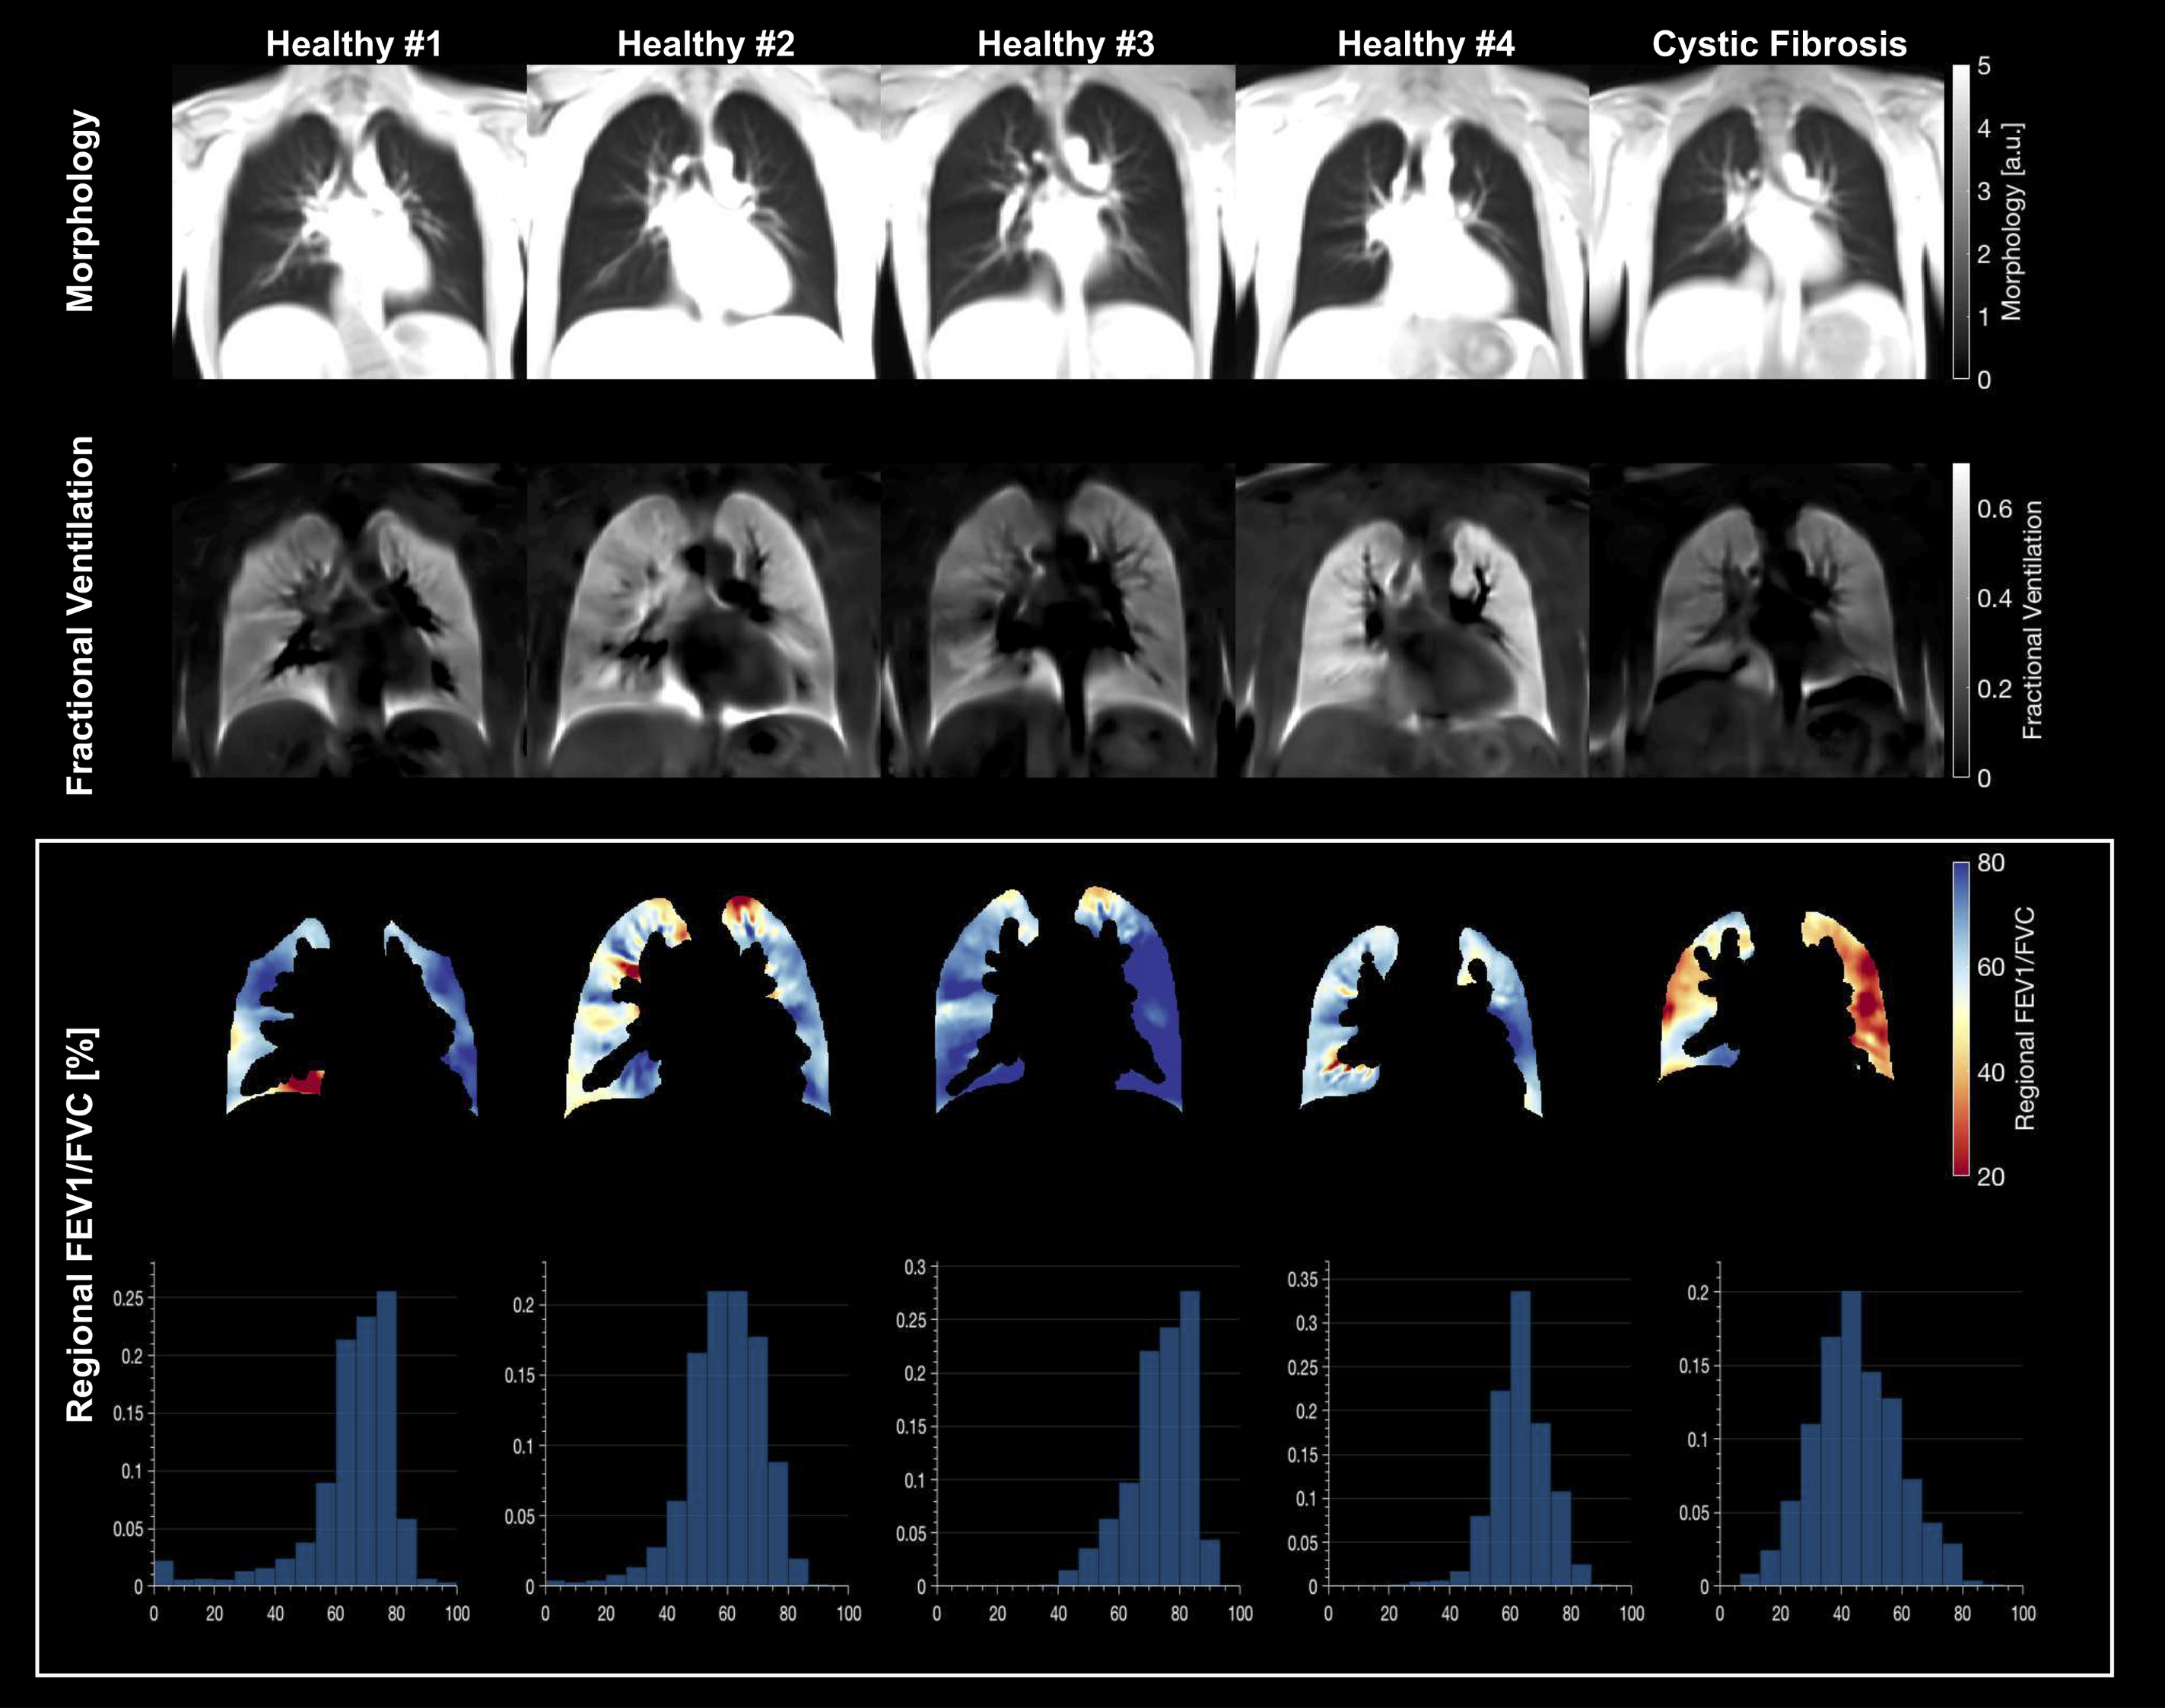
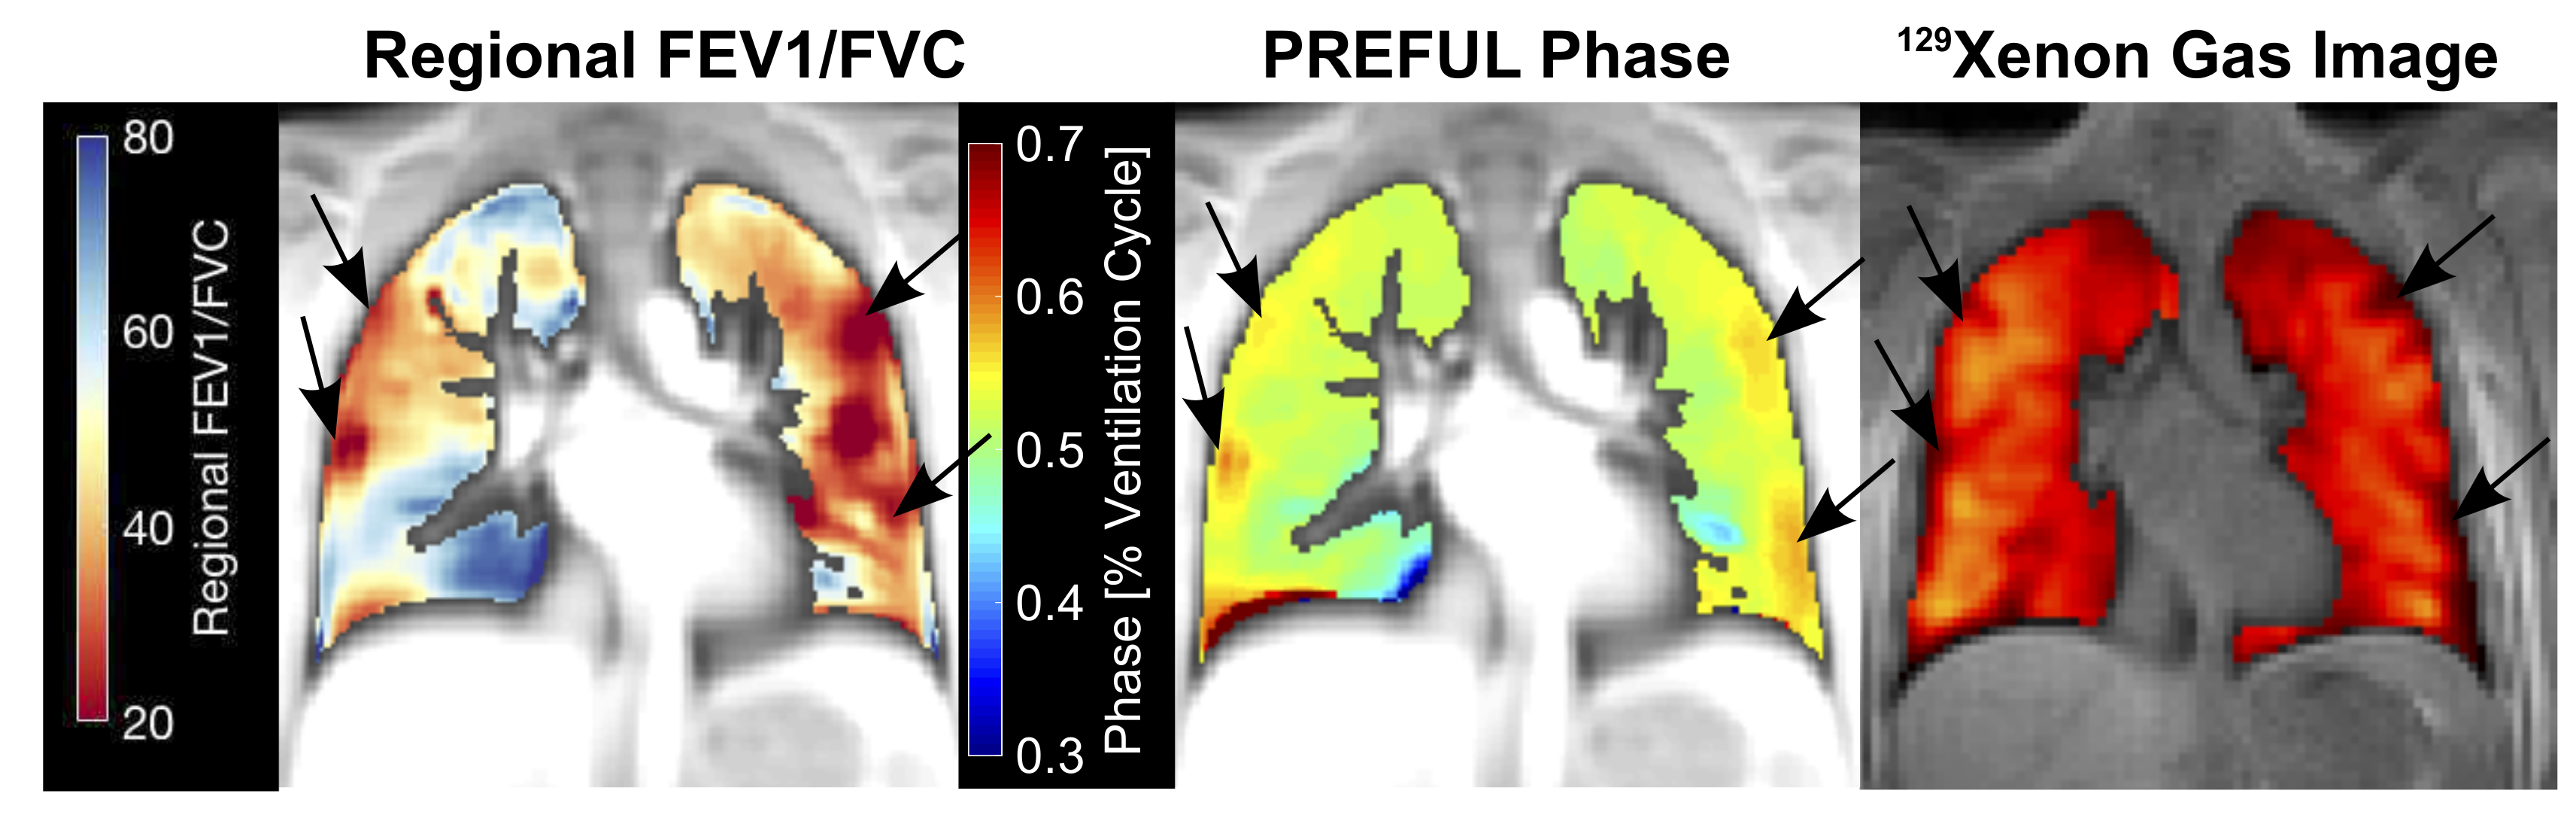
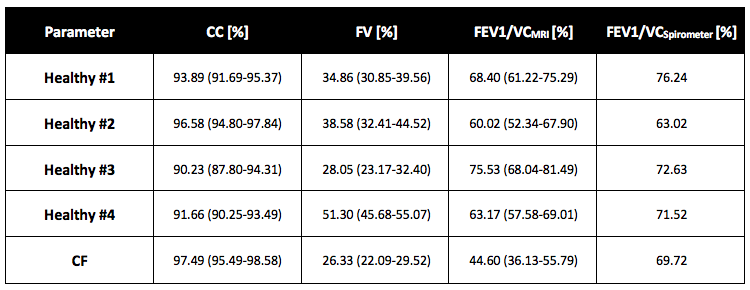
High regional correlation (median CC > 0.9) was obtained for the spirometer and the MRI time series 1/S for every subject in the lung parenchyma (see Figure 2 and Table 1). The FV maps were very homogenous and showed no prominent regions with hypo-ventilation (see Figure 3). The median FV values were between 26% and 51%. The regional distribution of FEV1/FVCMRI was more heterogeneous for all subjects, but displayed many regions with reduced FEV1/FVCMRI and a median value of 45% in the case of CF. The median FEV1/FVCMRI values in the healthy volunteers ranged from 60% to 75%. The comparison of PREFUL ventilation measurement and hyperpolarized 129Xe ventilation imaging showed a good visual agreement of delayed ventilation and low gas concentration with reduced FEV1/FVCMRI (see Figure 4).Discussion
The correlation results confirm the assumed relationship of MRI signal and lung volume on a regional level. The high FV values are likely due to the forced breathing maneuver. Considering the supine posture, the comparably low FEV1/FVCMRI/Spirometer values in healthy volunteers are plausible. Interestingly, the FEV1/FVCSpirometer of the CF patient was rather high (70%) but much lower values were detected with FEV1/FVCMRI (36-56%). This confirms the importance of regional information and demonstrates the need for more and faster spatial coverage e.g. using a 3D approach. Considering the recent 129Xe results that ventilation defect percentage is influenced by inspiratory lung volume8 and the presented results, which show potential sensitivity problems of FV, the dynamic acquisition of lung volumes will gain importance in the future.Conclusion
This study demonstrates a novel regional pulmonary function test for FEV1/FVC mapping with potential for high sensitivity for lung disease detection and monitoring, but will require more validation in patient cohorts with multi-slice acquistion.Acknowledgements
This work was supported by the German Centre for Lung Research (DZL). The authors thank Lars Kähler and Frank Schröder for their help during data acquisition.References
1. König P, Ner Z, Acton JD, Ge B, Hewett J. Is an FEV1 of 80% predicted a normal spirometry in cystic fibrosis children and adults? Clin Respir J. 2018;12(8):2397-2403. doi:10.1111/crj.12920
2. Gurney JW, Habbe TG, Hicklin J. Distribution of Disease in Cystic Fibrosis: Correlation with Pulmonary Function. Chest. 1997;112(2):357-362. doi:https://doi.org/10.1378/chest.112.2.357
3. Bauman G, Puderbach M, Deimling M, et al. Non-contrast-enhanced perfusion and ventilation assessment of the human lung by means of fourier decomposition in proton MRI. Magn Reson Med. 2009;62(3):656-664. doi:10.1002/mrm.22031
4. Voskrebenzev A, Gutberlet M, Klimeš F, et al. Feasibility of quantitative regional ventilation and perfusion mapping with phase-resolved functional lung (PREFUL) MRI in healthy volunteers and COPD, CTEPH, and CF patients. Magn Reson Med. 2018;79(4):2306-2314. doi:10.1002/mrm.26893
5. Voskrebenzev A, Klimeš F, Gutberlet M, et al. Imaging-Based Spirometry in Chronic Obstructive Pulmonary Disease (COPD) Patients using Phase Resolved Functional Lung Imaging (PREFUL). In: Proc. Intl. Soc. Mag. Reson. Med. 26. ; 2018:1079.
6. Avants BB, Tustison NJ, Song G, Cook PA, Klein A, Gee JC. A Reproducible Evaluation of ANTs Similarity Metric Performance in Brain Image Registration. Neuroimage. 2011;54(3):2033-2044. doi:10.1016/j.neuroimage.2010.09.025
7. Voskrebenzev A, Gutberlet M, Kaireit TF, Wacker F, Vogel-Claussen J. Low-pass imaging of dynamic acquisitions (LIDA) with a group-oriented registration (GOREG) for proton MR imaging of lung ventilation. Magn Reson Med. 2017;78(4):1496-1505. doi:10.1002/mrm.26526
8. Smith L, Hughes P, Marshall H, et al. Hyperpolarised gas MRI shows a decrease in lung ventilation defects at increased inspiratory lung volumes in Cystic Fibrosis . Proc Intl Soc Mag Reson Med 26 . 2018:1083.
Figures